TOTAL Marketcap / Crypto Total Market Cap
TOTAL daily analysis 10/03/2026. The total crypto market cap index is trading in a compressed structure where sellers still control the broader context, but the market is holding a key reversal framework that has not been invalidated yet.
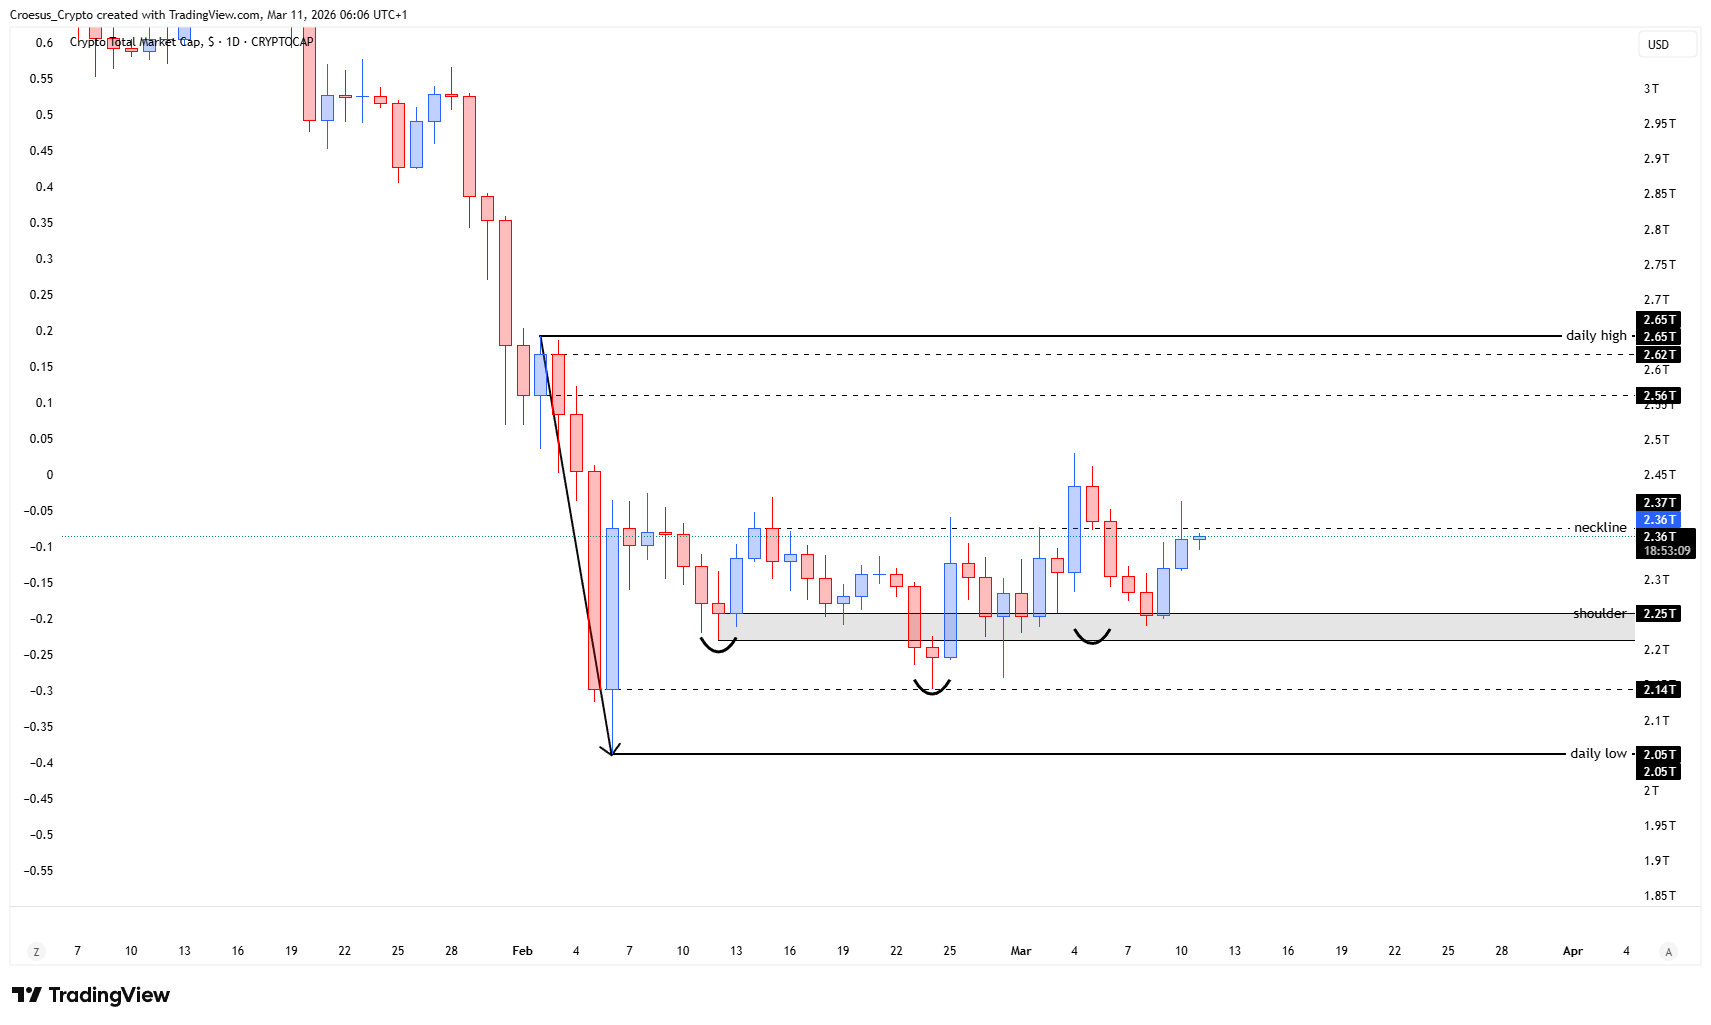
- The index retested the neckline but remained inside the local range between the shoulderlevel and the neckline.
- At this moment the inverse head and shoulder pattern is still in play
Market Structure Analysis
Our TOTAL daily analysis focuses on the current balance between a bearish backdrop and a potential reversal structure. Price retesting the neckline and failing to expand out of the local range suggests the retest is being absorbed rather than followed by immediate continuation.
Structurally, this keeps the market in a “decision zone” where horizontal support resistance matters more than prediction: the neckline acts as the upper boundary (overhead resistance in the current range), while the shoulderlevel acts as the lower boundary (structural support and the key area that keeps the inverse head and shoulder idea alive). As long as price remains boxed between these two levels, the dominant read is consolidation and compression rather than a clean impulse.
Key Levels and Scenarios
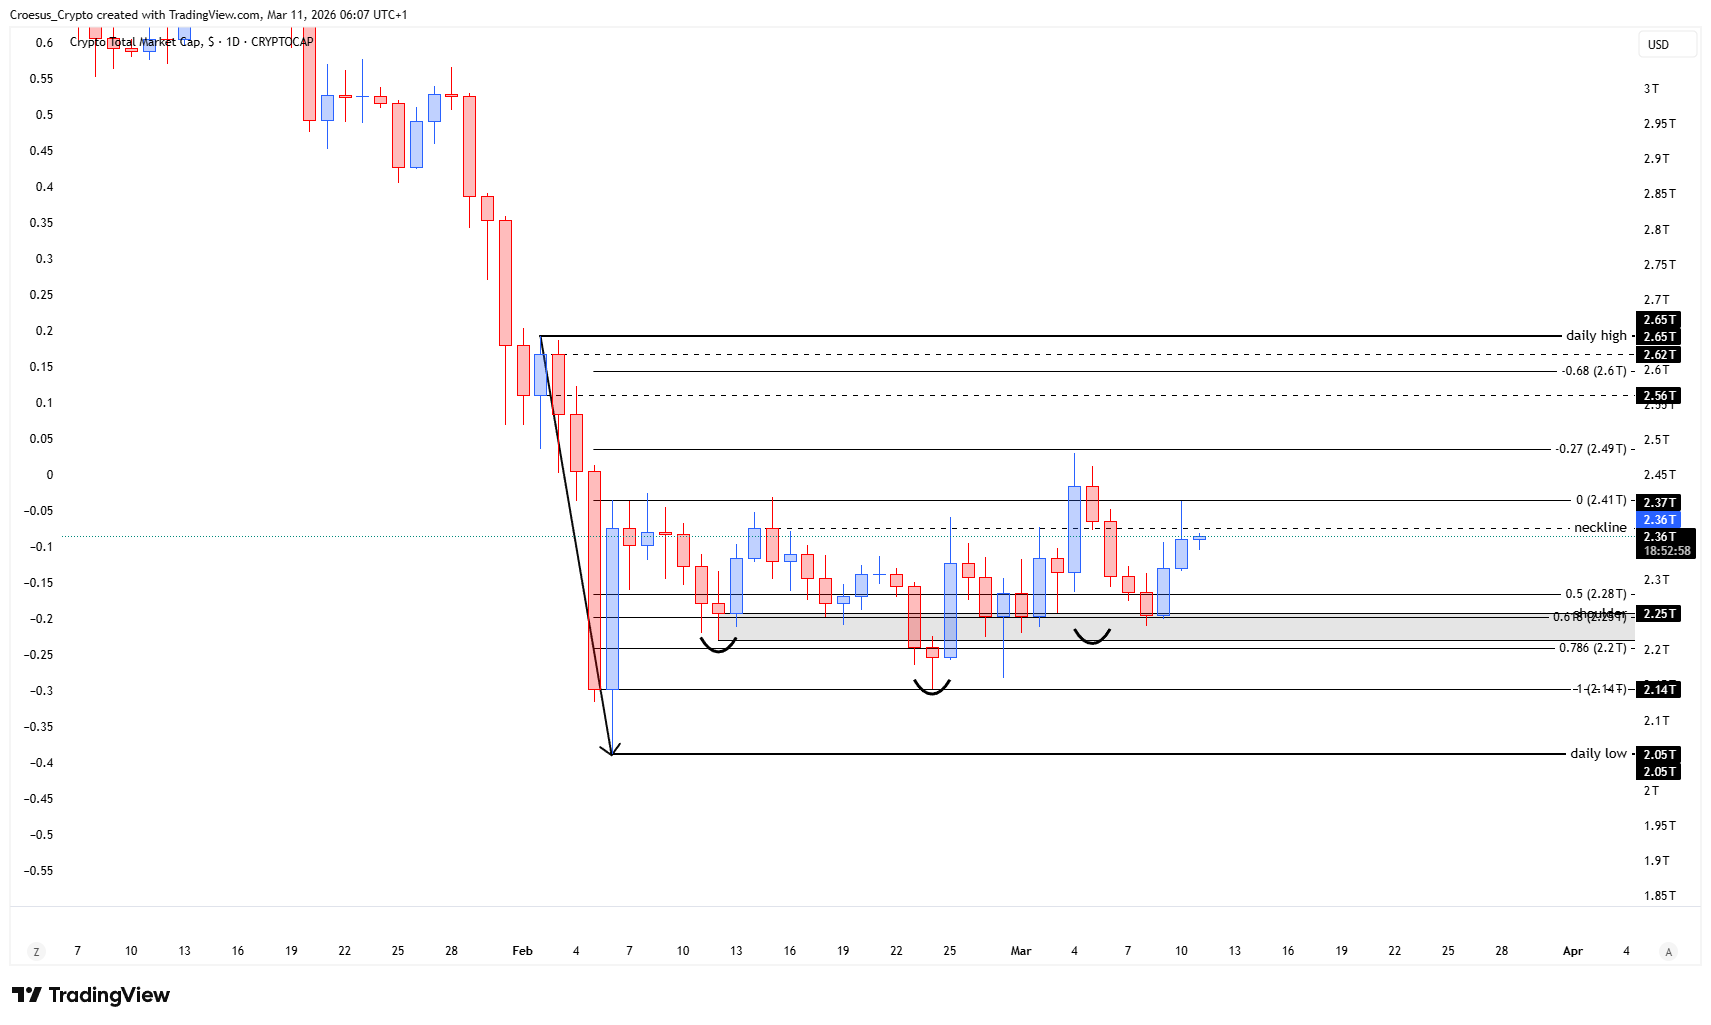
In this TOTAL daily analysis, bearish continuation remains the base case while price is unable to reclaim the neckline and break out of the range. A bullish alternative only develops if the market proves acceptance above the neckline and transitions from range behavior into an impulsive reclaim.
- Neckline: key resistance and the level that must be reclaimed to shift momentum
- Shoulderlevel: key structural support; losing it weakens the reversal framework
Trading Implications
With price stuck between two clear horizontal levels, risk is typically defined by waiting for confirmation: aggressive participants may trade the range edges, while conservative participants usually wait for a break and acceptance outside the local range. The cleanest invalidations come from decisive closes beyond the neckline or shoulderlevel, rather than intraday wicks.
This analysis is for informational purposes only and does not constitute financial advice.