TOTAL Marketcap / Crypto Total Market Cap
TOTAL daily analysis 11/03/2026. Our TOTAL daily analysis shows the index retesting a major neckline area and failing to reclaim it, keeping short-term market structure under pressure and signalling that sellers still control this key support resistance zone.
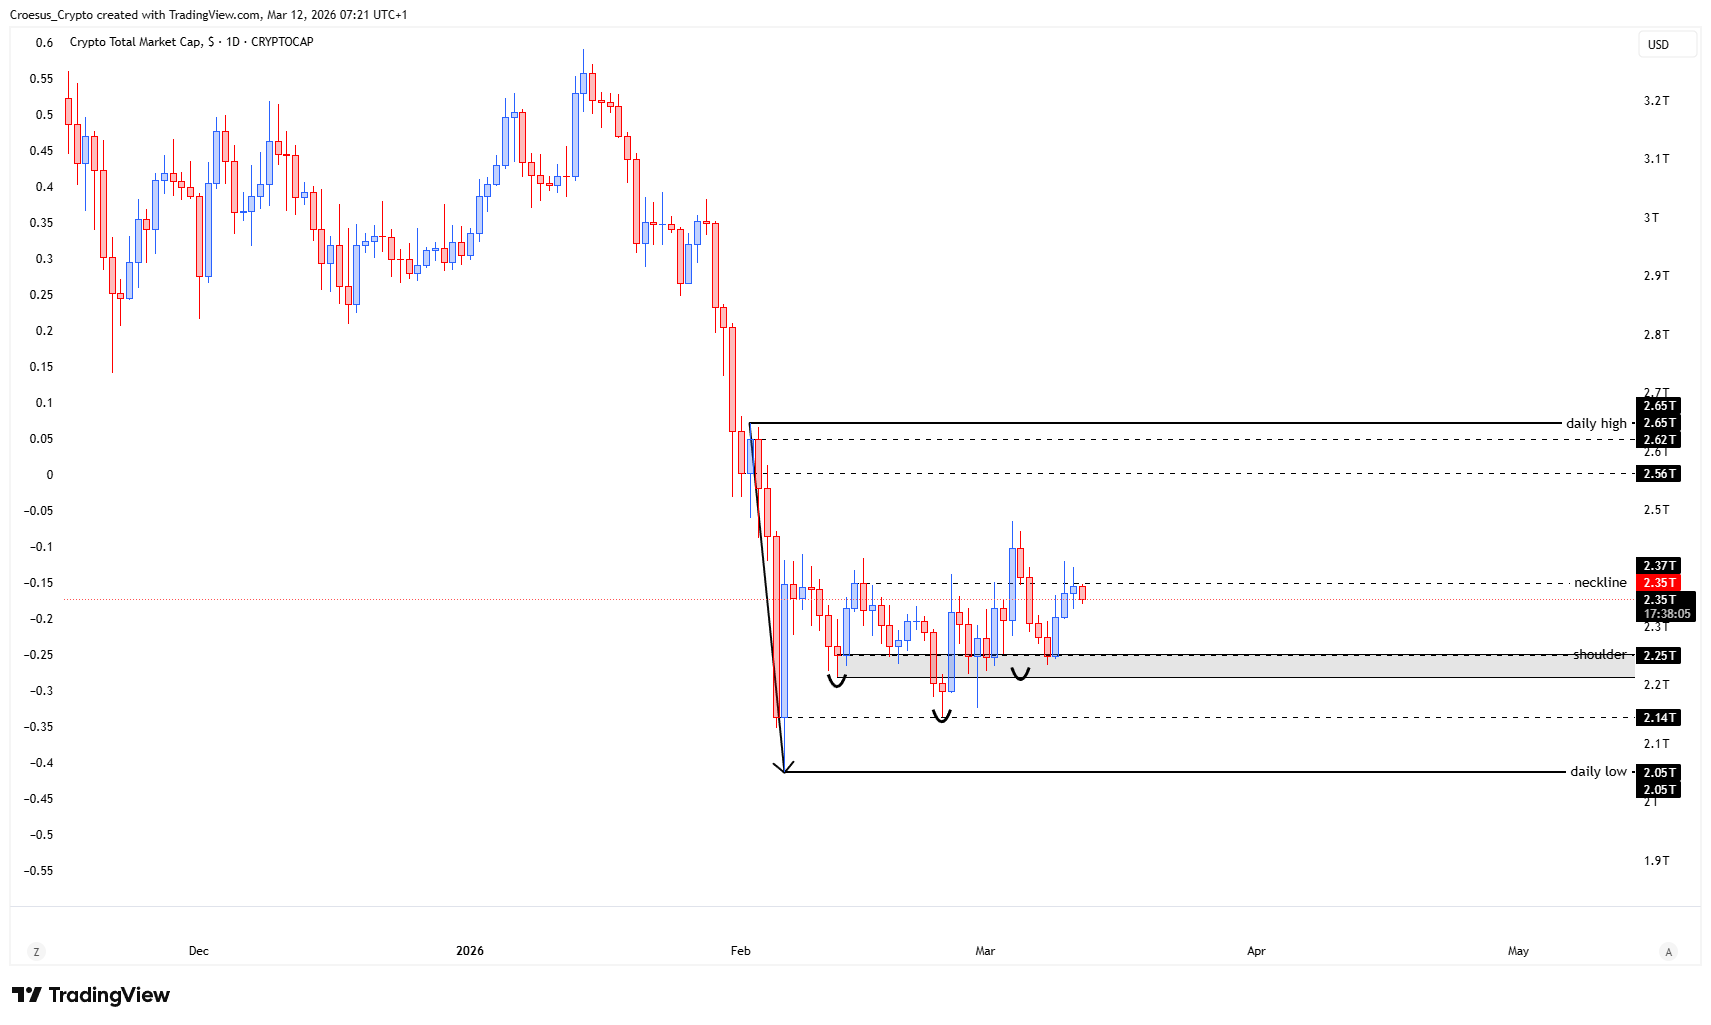
- The index retested the neckline again, closing below that level again.
- This could indicate us that the bulls are not strong enough yet and need that look for more liquidity. Either on the shoulderlevel or below the head.
Market Structure Analysis
Structurally, a neckline retest that closes back below the level typically confirms the strength of the resistance (for now).
In our TOTAL daily analysis, this behaviour suggests the market is still rotating in a bearish corrective-to-impulsive sequence, where demand is not yet strong enough to absorb supply at the neckline. The comment about “more liquidity” points to a likely draw into lower structural zones, commonly the prior shoulder level first, and—if that fails—the area below the head where the deepest demand previously stepped in.
Until price can reclaim the neckline with acceptance (clean close back above and hold), the path of least resistance remains to the downside.
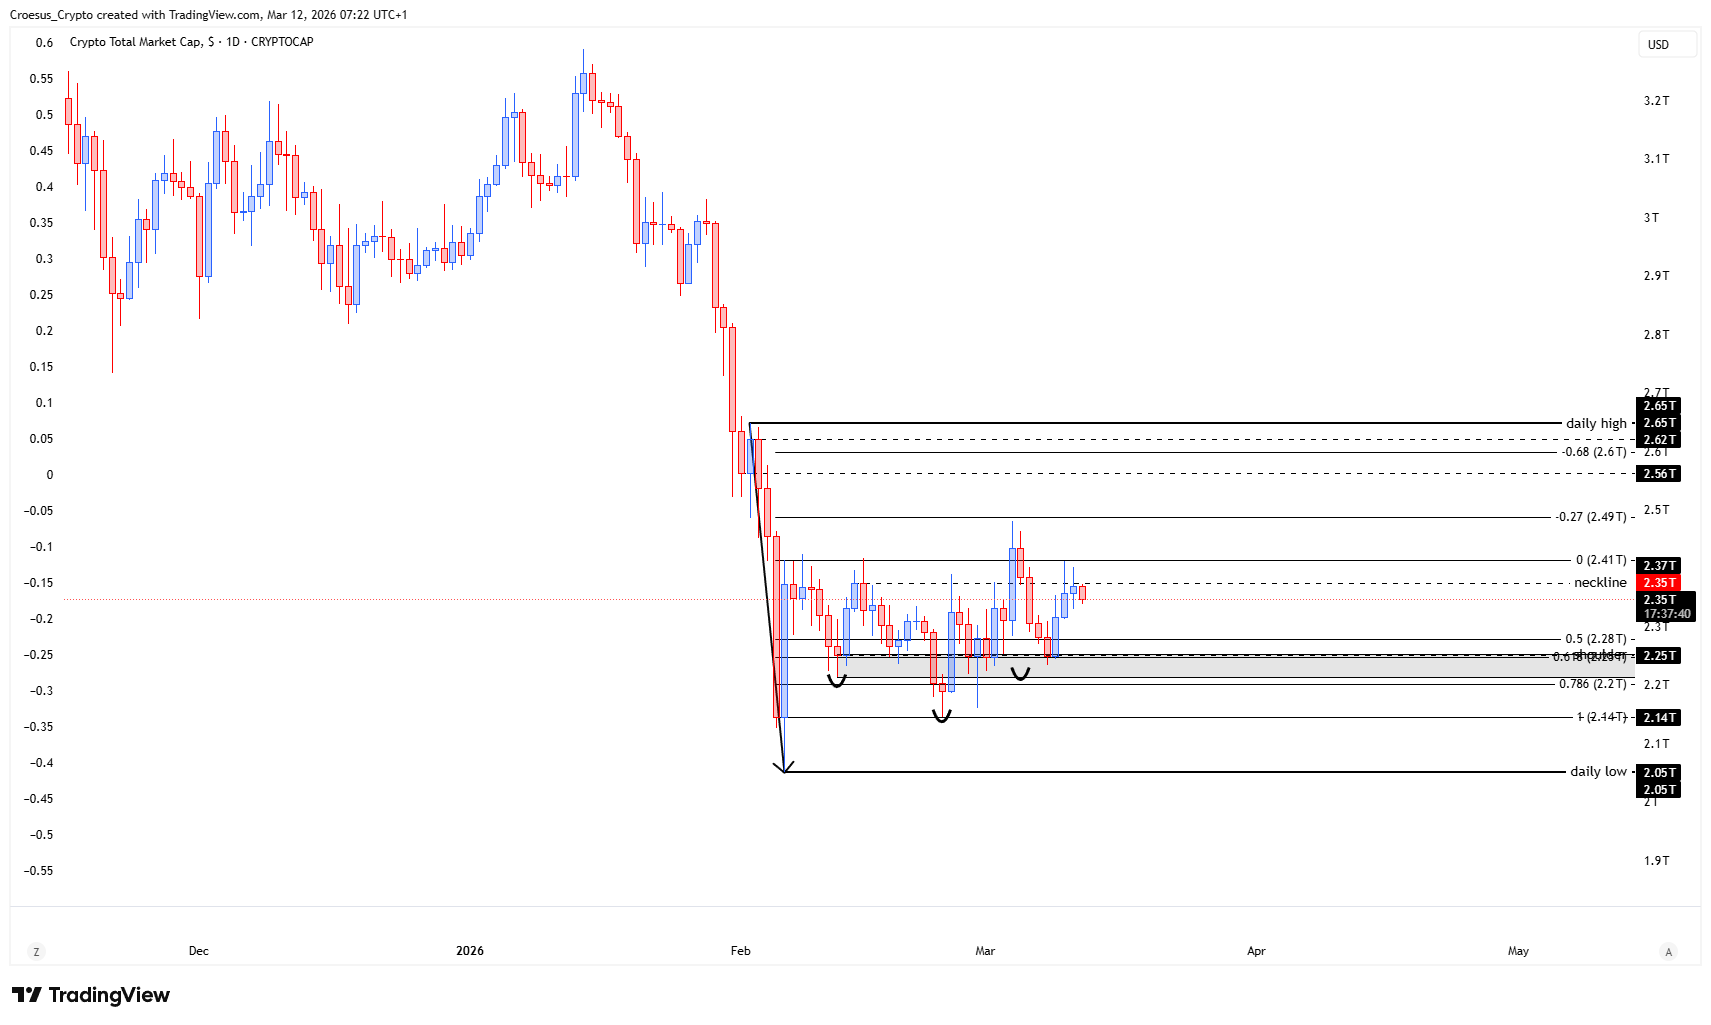
Key Levels and Scenarios
For bullish relief, the index needs to reclaim the neckline and hold it as support; without that, any bounce is vulnerable to becoming another rejection.
For bearish continuation, continued acceptance below the neckline keeps the current technical analysis aligned with a move into the next lower liquidity pocket.
- Neckline: key pivot level; repeated close below keeps it as resistance
- Neckline retest zone : failure area that confirms seller control if price keeps rejecting
- Shoulderlevel: first downside liquidity/support area referenced in the current structure
- Below the head: deeper downside liquidity area if the shoulderlevel does not hold
Trading Implications
With the neckline acting as a ceiling, aggressive participants typically treat rallies into that zone as higher-risk conditions, while conservative participants generally wait for confirmation (either a reclaim and hold above the neckline, or clear continuation lower into the shoulder/head liquidity areas). Risk management stays critical because neckline retests often produce volatile wicks before direction resolves.
This analysis is for informational purposes only and does not constitute financial advice.