


Our TOTAL daily analysis for 12 December 2025 focuses on the post-selloff structure now developing between clearly defined support and resistance after a sharp impulse down in total crypto market cap.
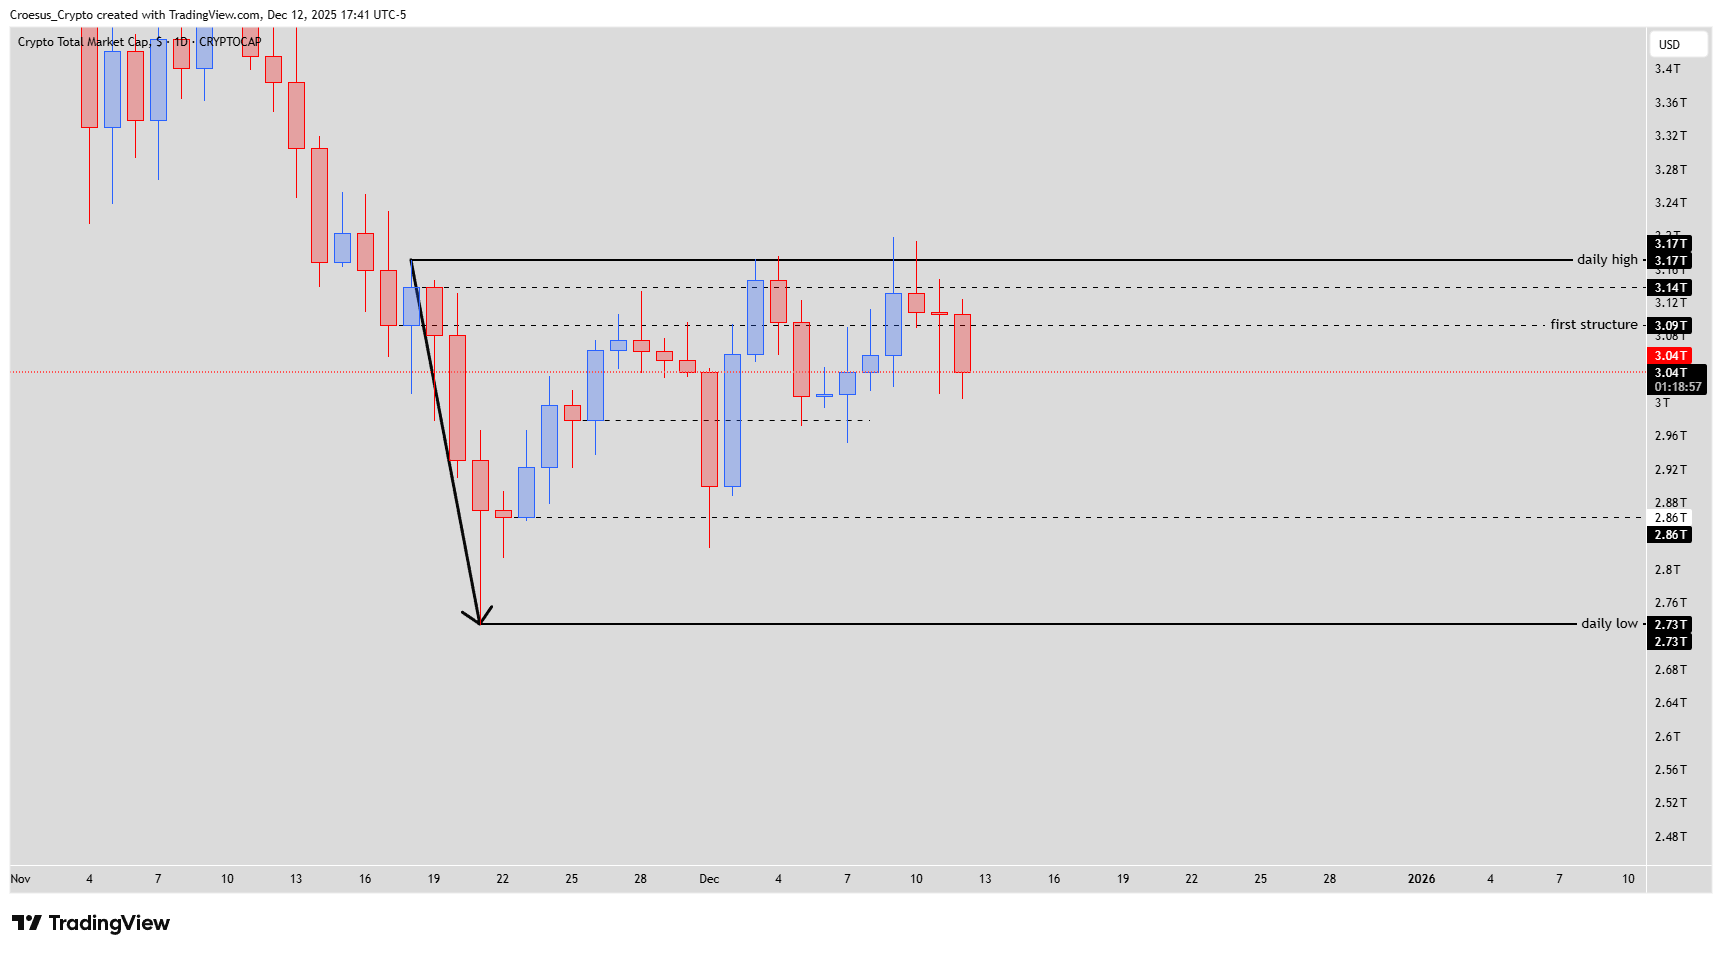
TOTAL daily chart December 12 2025 with post-selloff range between 2.73T and 3.17T, showing first structure at 3.09T and mid support at 2.86T.
Technical analysis
- Market cap printed a sharp impulsive drop into the 2.73T daily low before a strong reaction higher
- Price now trades inside a broad daily range between the 2.73T low and the 3.17T daily high
- “First structure” resistance around 3.09T caps the upside with several failed attempts to break higher
- Intermediate support near 2.86T holds so far, keeping the current range intact
- A daily close back below 2.86T would open the door for a full retest of the 2.73T daily low
- A bearish set-up is possibly forming at this moment : a head & shoulder pattern with a double top
Market Structure Analysis
From a technical analysis perspective, the dominant feature on this TOTAL daily analysis is the impulsive leg down followed by a sideways consolidation. The current box between 2.73T and 3.17T represents a classic corrective structure after strong selling. As long as price rotates between the 2.86T mid-support and the 3.09T first structure resistance, we treat this as a neutral range with no clear directional edge, and horizontal support resistance levels remain our main reference rather than Fibonacci confluence.
Key Levels and Scenarios
Bullish scenario: A decisive daily close above 3.09T, and ideally a follow-through into the 3.17T daily high, would suggest buyers are regaining control and could target the next liquidity pockets above the current range in this TOTAL daily analysis.
Key levels to watch:
3.17T – Daily high and range top; break and hold turns structure short-term bullish
3.09T – First structure resistance; pivot for intraday bias and invalidation for aggressive shorts
3.04T area – Current price region, inside the middle of the range
2.86T – Mid-range support; loss of this level signals sellers reclaim momentum
2.73T – Daily low and range bottom; breakdown here reactivates the larger downside trend
Trading Implications
With TOTAL in a neutral daily range between 2.73T and 3.17T, our analysis favors range-trading tactics over trend-following until we see a confirmed breakout.
For longs, the cleaner spots are closer to support: reactive bids around 2.86T with tight invalidation just below that level, and more conservative entries only near the 2.73T daily low if it shows a clear rejection. Target-wise, partial profit-taking back into the 3.04T mid-area and then the 3.09T “first structure” makes sense, with runners only if price starts to press into 3.17T.
For shorts, the asymmetric locations are at the top of the box: failed breaks or exhaustion signals into 3.09T–3.17T can offer low-risk fade setups, with stops just above 3.17T and initial targets back towards 3.04T and 2.86T.
Position sizing should stay moderate while we’re trapped inside this choppy structure: volatility can spike on both edges of the range, so we prefer smaller size and clearer invalidation rather than over-leveraging in the middle of the box where signal-to-noise is poor. A daily close outside either 2.73T or 3.17T would invalidate the range-trading idea and shift us back to breakout/impulse strategies.
This is not financial advice; always do your own research and manage risk accordingly. The structure of this analysis follows our internal trade plan framework.