


TOTAL Marketcap / Crypto Total Market Cap
In this TOTAL daily analysis for 12 February 2026, we focus on the slowing bearish correction that followed the sharp drop in total crypto market cap. As always, we apply our “naked trading” focus on clean charts, market structure and support resistance rather than indicators.
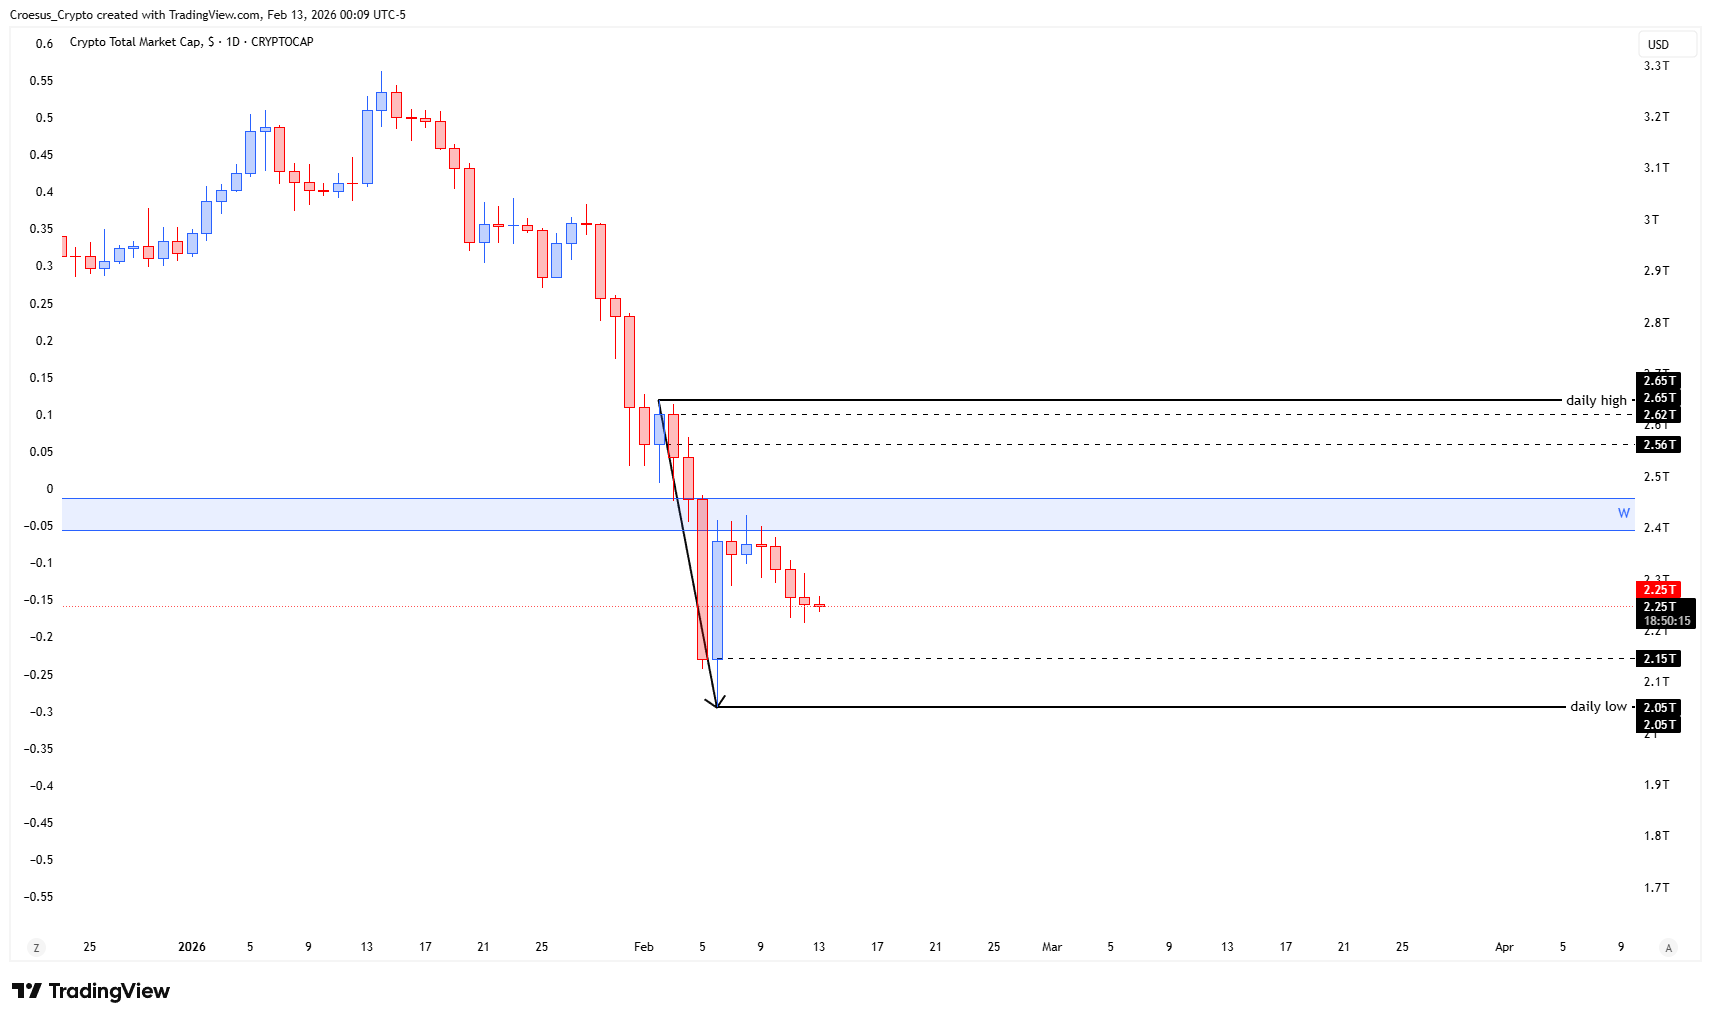
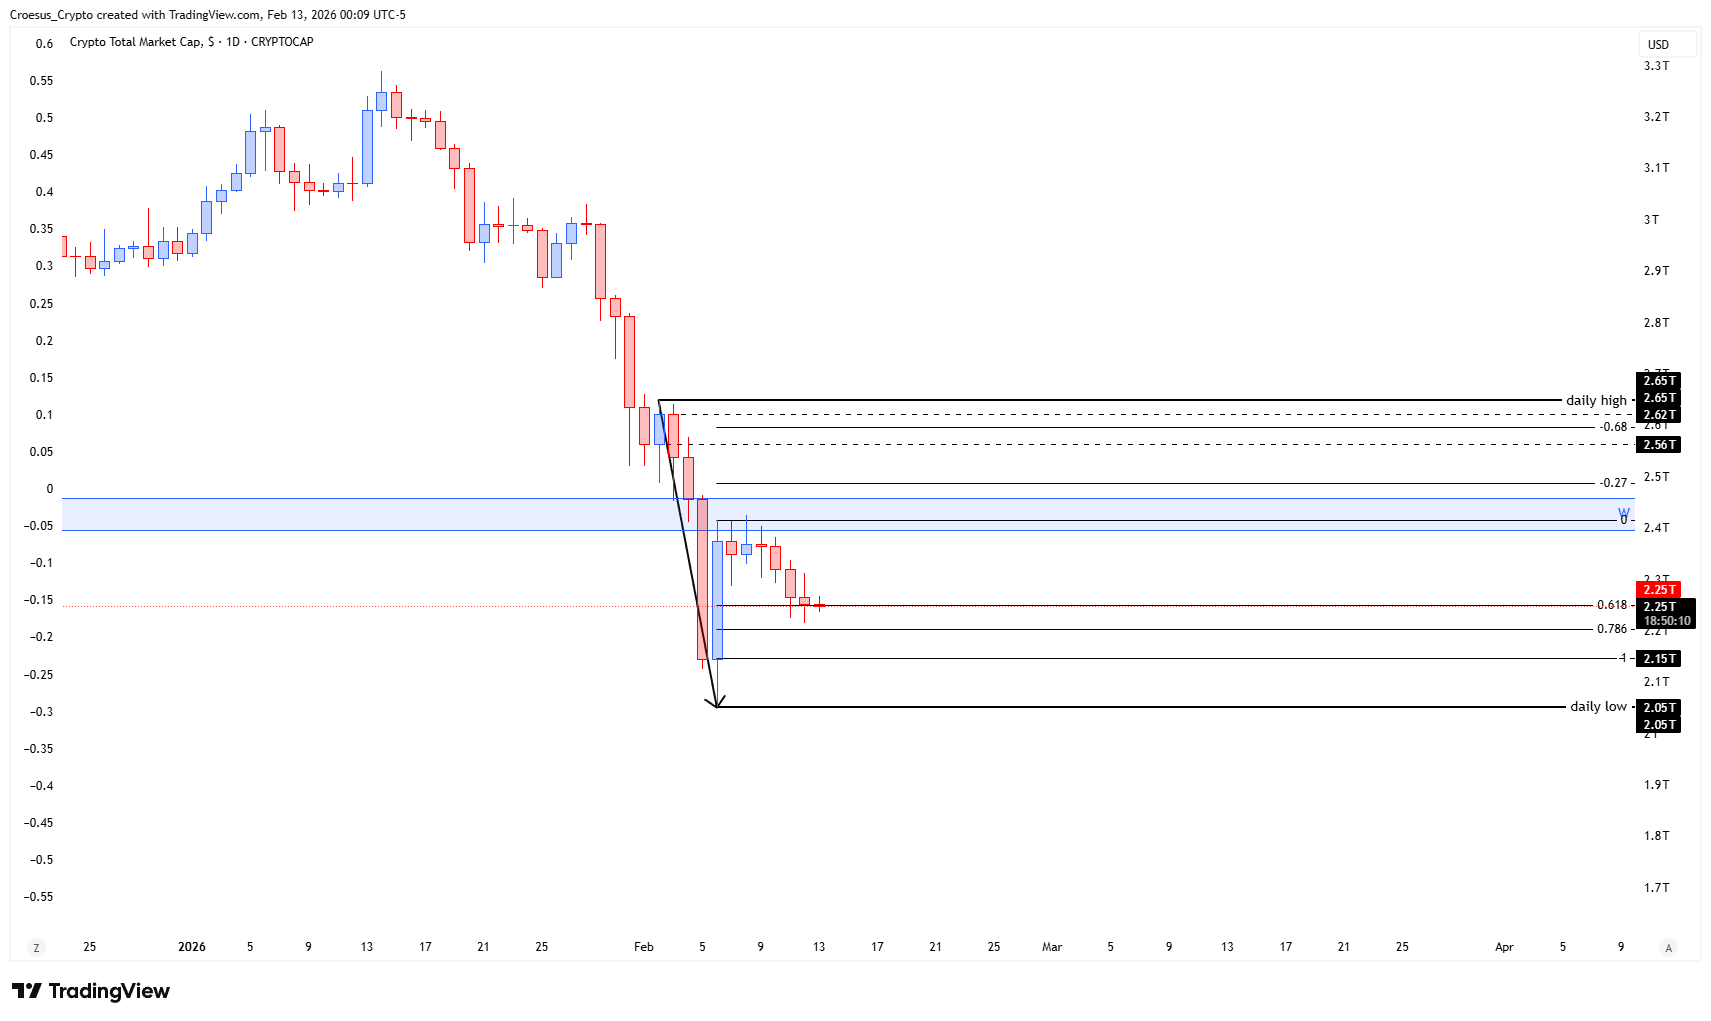
- TOTAL is showing us a bearish correction slowing down, indicating us a possible printing of the B-leg in a ABC correction
- if this plays out we might see a bullish corrective move. Nevertheless it would still fit in a larger bearish pattern.
Market Structure Analysis
Our technical analysis shows an impulsive A-leg selloff into the 2.05T “daily low”, followed by a slower, overlapping correction. This price action is typical for a developing B-leg in an ABC correction: volatility compresses, candles shrink and momentum fades while price holds above the initial low.
Current consolidation hovers between roughly 2.15T and 2.25T, with 0.618 and 0.786 Fibonacci retracements adding confluence to this resistance band. As long as TOTAL remains capped below the wider 2.4T–2.65T supply region and below the prior “daily high” at 2.65T, the higher-timeframe structure stays bearish.
Key Levels and Scenarios
Bullish scenario in this TOTAL daily analysis: a squeeze from the current range towards 2.25T and potentially into the 2.4T–2.65T resistance pocket, still treated as corrective within the larger downtrend.
Critical levels to watch:
- 2.05T – Daily low and key downside invalidation; loss opens room for a C-leg extension.
- 2.15T – Local support inside the range; holding keeps B-leg structure intact.
- 2.4T–2.5T zone – Strong supply; rejection here would reinforce the broader bearish pattern
- 2.65T daily high – Major resistance; sustained break needed to challenge the bearish thesis.
Trading Implications
For active traders, this remains a counter-trend environment: any long exposure should be sized conservatively, focused on short-term corrective targets within the B-leg, with invalidation placed below 2.05T and awareness that the dominant structure still favors a subsequent C-leg lower.
This analysis is for informational purposes only and does not constitute financial advice.