


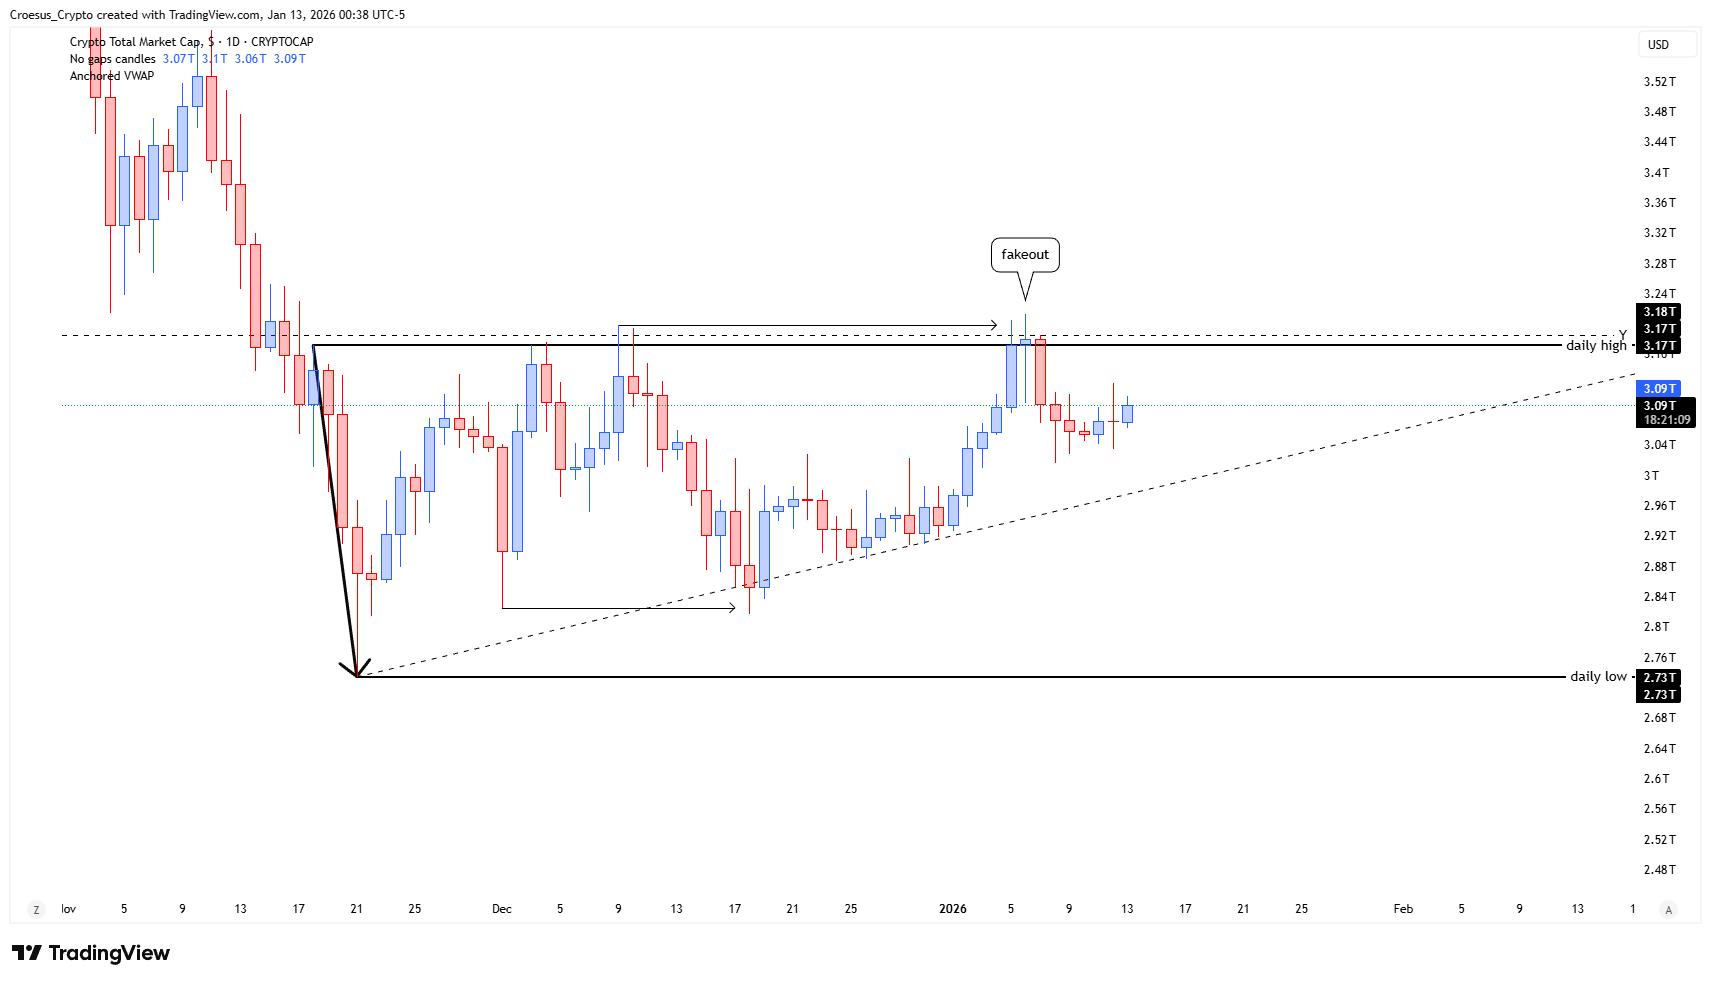
Our TOTAL daily analysis for 12 January 2026 focuses on the strong bearish impulse from 19 November 2025 and the broad range that formed afterwards. Price remains inside this daily range, with resistance near the prior daily high around 3.17T and support at the daily low near 2.73T, as our technical analysis highlights.
TOTAL daily chart 12 January 2026 with fakeout above daily high, broad daily range, and rising trendline
Technical analysis
- With the strong bearish impulse that started on 19 November 2025, the index created a wide daily range. Although price tried to push higher, it was nothing more than a fakeout. The day after, we already closed back below the daily high and back into the range.
- The price action leading to that fakeout was a strong internal bullish impulse that now seems to be correcting. The Fib 0.618 level has already been tapped, so the Fib retracement has been activated. That means the bullish reaction we are seeing now was to be expected, but it could still be part of a larger ABC correction back to the base of the impulse.
- Bullish scenario: As noted in the weekly analysis, we would like to see a strong break and retest above the yearly high. This would also indicate a breakout above the daily high and out of the long-term daily range.
- Bearish scenario: The index goes higher, attacks the daily high again, but fails and breaks the upward trendline. This could trigger a potential sell-off, cleaning up all of the trendline liquidity that has been built up.
Market Structure Analysis
The market structure is defined by the sharp November sell-off, which created the current daily range between roughly 2.73T and 3.17T. The internal bullish impulse into early January pushed price above the daily high but failed, resulting in a clear fakeout and immediate close back inside the range. This reinforces 3.17T as key resistance in our support resistance map. The subsequent pullback already tagged the 0.618 Fibonacci retracement of that internal impulse, so the current bounce fits well within a corrective framework and could still evolve into a full ABC move back toward the base of the impulse and potentially the range low.
Key Levels and Scenarios
Key Levels and Scenarios
Bullish scenario: Bulls need a decisive breakout above 3.17T (daily high) and the yearly high, followed by a clean retest holding as support. That would confirm a range breakout and open room for a larger impulsive leg higher.
Critical levels to watch:
3.17T – Daily high / range resistance: Fakeout area; a strong close above would signal strength.
Yearly high region: Confluence with range top; successful retest would confirm bullish continuation.
3.00T–3.05T mid-range zone: Short-term pivot; holding above favors continued bullish correction.
Rising daily trendline: A break below would warn that the corrective structure is failing.
2.73T – Daily low / major support: If the trendline and mid-range fail, a retest of this low becomes likely.
Trading Implications
As long as price trades inside the range, we see better risk/reward by waiting for confirmation: either a clean breakout and retest above 3.17T for longs, or a failed retest of the daily high followed by a trendline break for tactical shorts, always aligned with predefined trade plans and position sizing rules.
This is not financial advice; always do your own research and manage risk accordingly. The structure of this analysis follows our internal trade plan framework