TOTAL Marketcap / Crypto Total Market Cap
TOTAL daily analysis 12-03-2026. Our TOTAL daily analysis focuses on a critical neckline retest area, where price is attempting to reclaim structure after repeated tests, but confirmation still depends on the daily close.
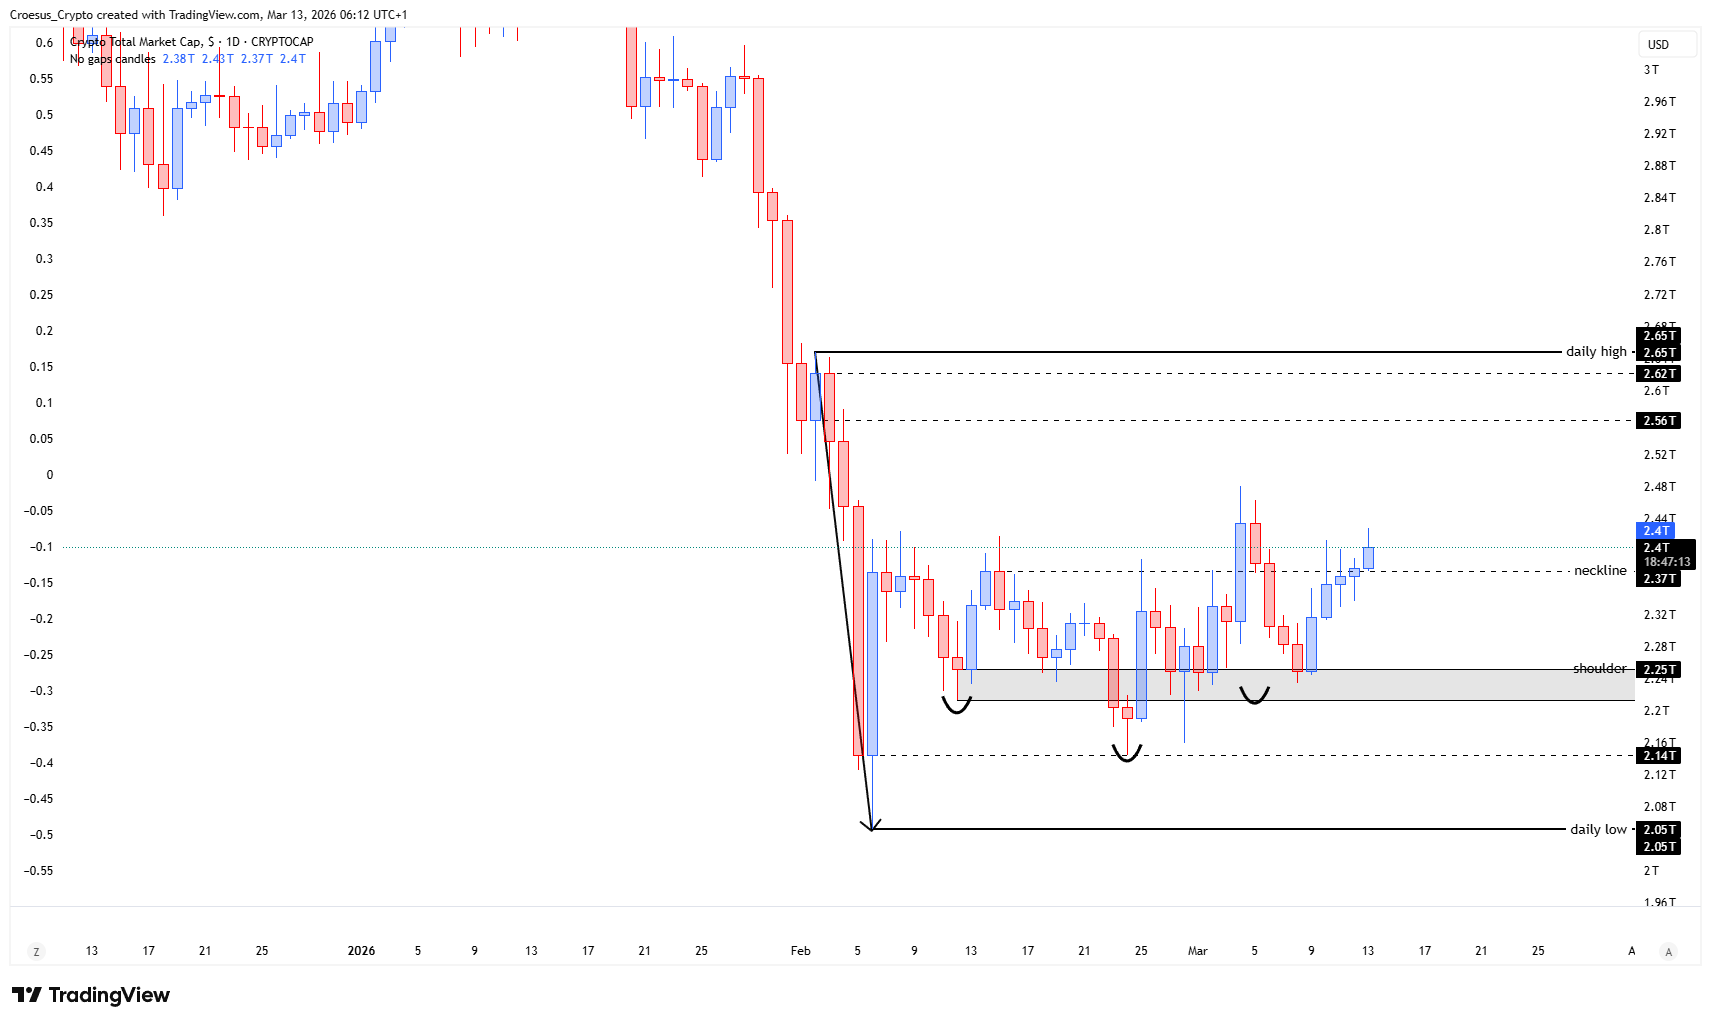
- The index tested the neckline for the third time, and closing above it this time
- Eventhough we can't rely on the last candle yet (candle has not closed yet), we see a first positive reaction. The daily candle close will tell us more if we have seen a confirmed or failed break.
Market Structure Analysis
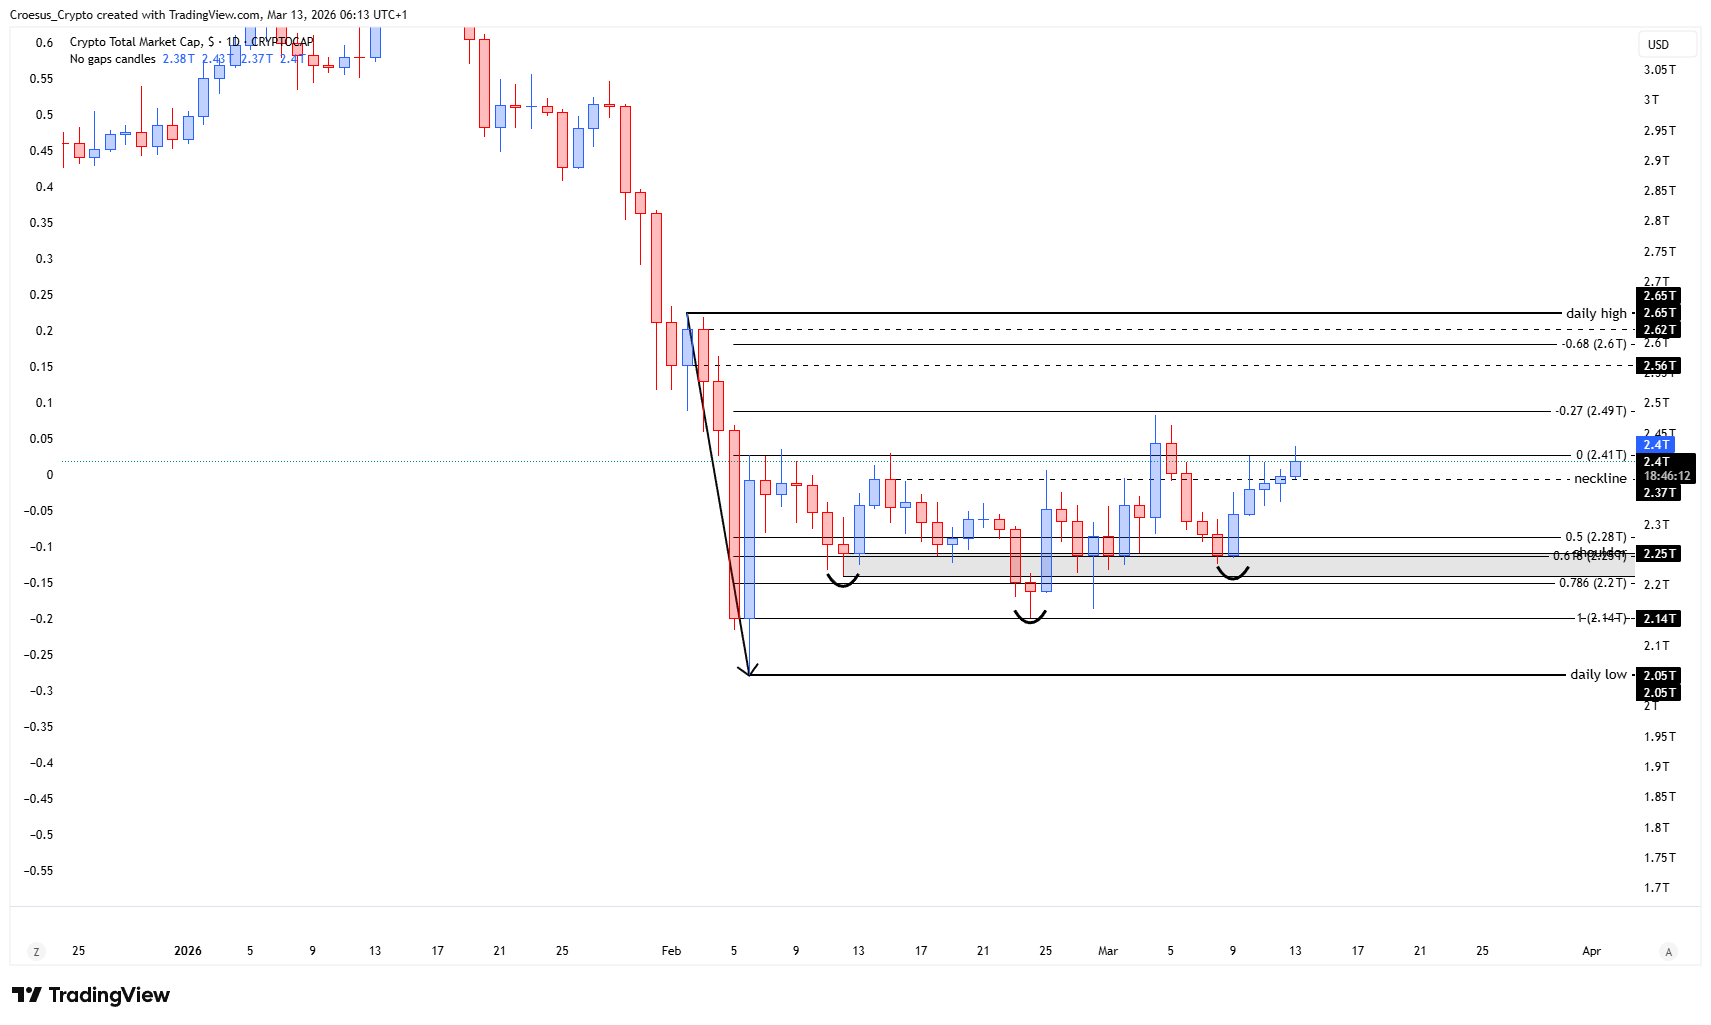
In this TOTAL daily analysis, the third time neckline test is the main structural event: repeated touches of the same horizontal level typically compress liquidity and increase the probability of either a clean break and acceptance above, or a sharp rejection that confirms the neckline as resistance.
The fact that price is currently closing above it (intraday) signals an initial bid and a potential shift from a bearish corrective structure into a reclaim attempt. However, since the candle has not closed yet, the market is still in decision mode: acceptance requires a clean daily close above the neckline and follow-through, while a failure would show rejection and keep the bearish structure intact. From a support resistance perspective, this neckline is the immediate “line in the sand” for the next impulse.
Key Levels and Scenarios
Bullish follow-through requires the market to hold above the neckline on a daily close and convert it into support; that would signal acceptance and open room for continuation into the next resistance zone. Bearish continuation remains the base case while trend is bearish: a failed break (daily close back below the neckline) keeps the neckline as resistance and increases odds of a sell-side push back into the prior range.
- Neckline: primary decision level for support resistance and structure
- Daily close relative to the neckline: confirmation vs failed break trigger
- Neckline retest zone: area to watch for acceptance (support) or rejection (resistance)
- Breakdown back below the neckline: structural failure signal that aligns with bearish trend
Trading Implications
With trend still bearish, our TOTAL daily analysis favors patience and confirmation: aggressive traders typically react to the first reclaim attempt, while conservative traders wait for a confirmed daily close and a clear retest that holds. Until that happens, the neckline remains a high-volatility inflection point where failed breaks can unwind quickly.
This analysis is for informational purposes only and does not constitute financial advice.