


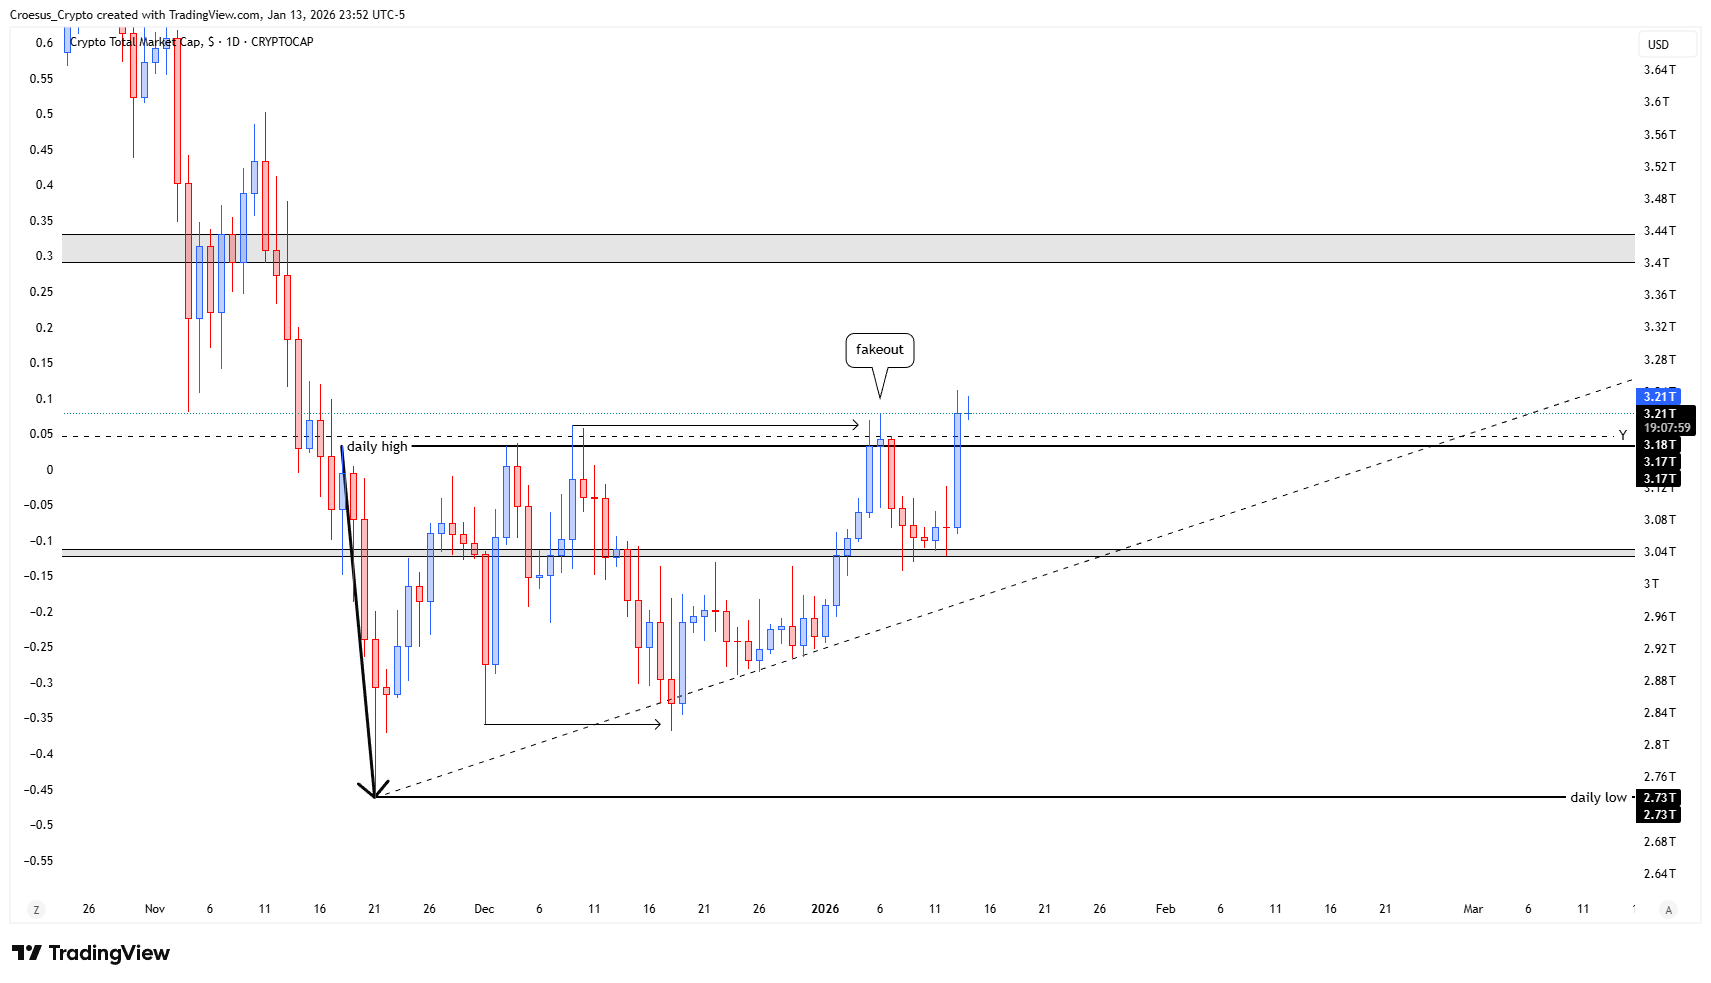
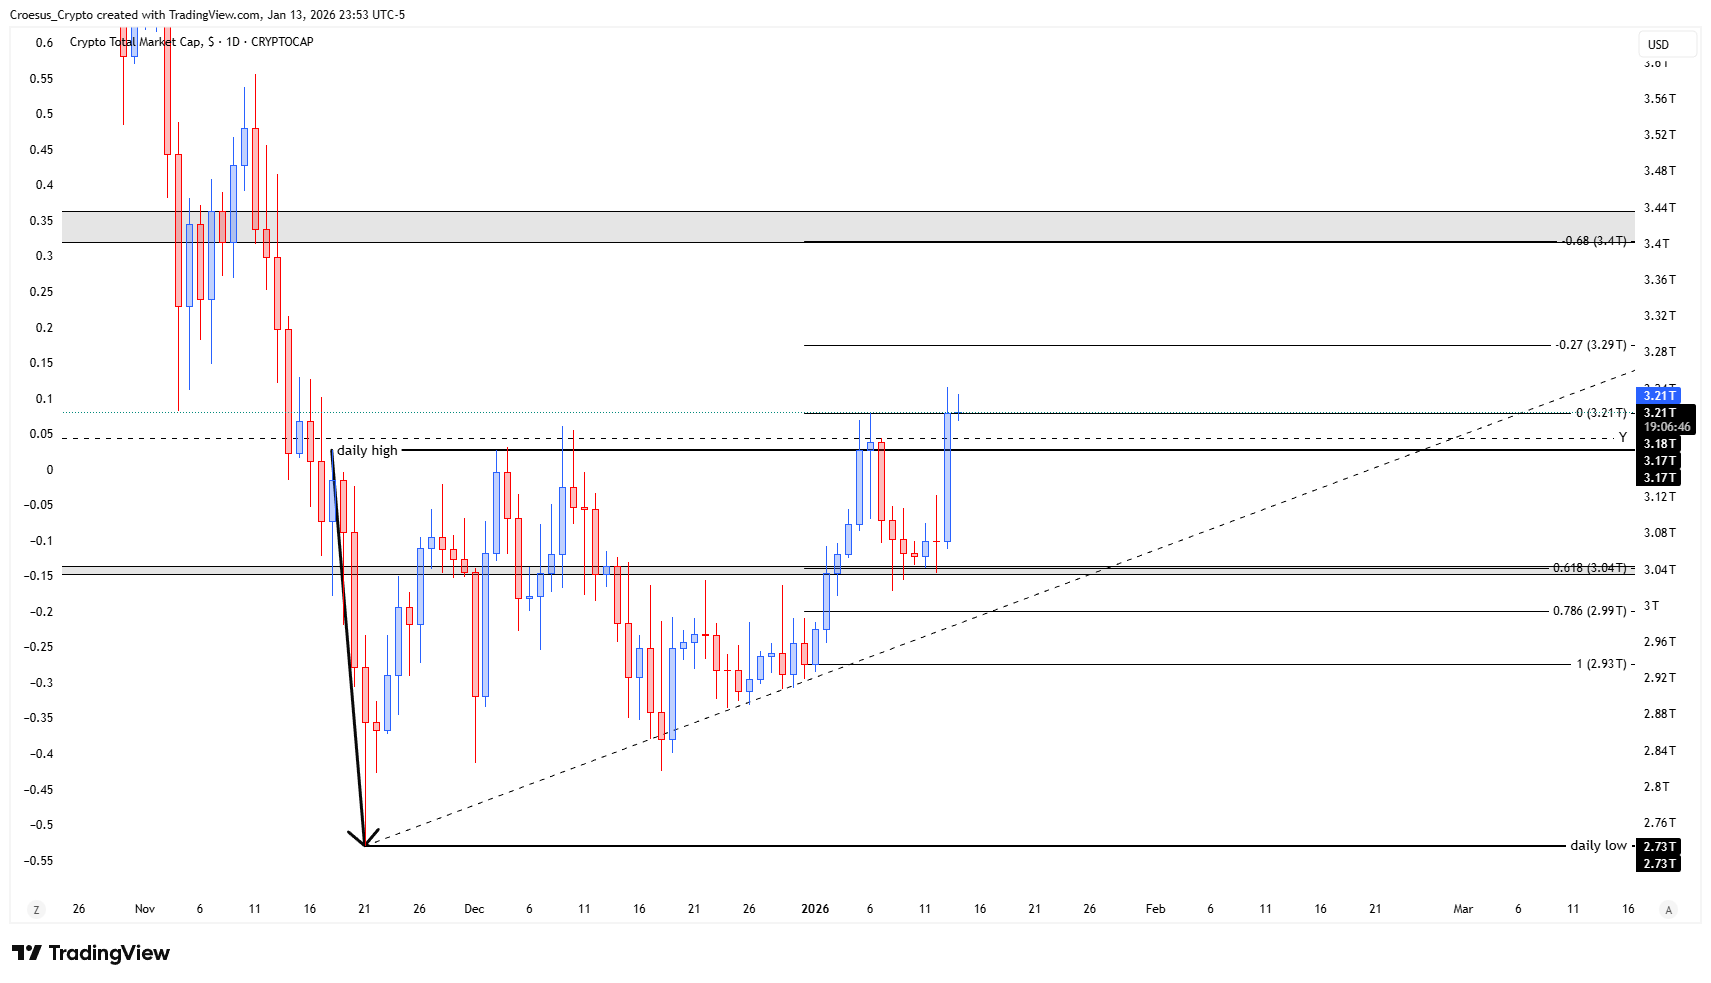
In this TOTAL daily analysis for 13 January 2026, we focus on the clean breakout that followed a prolonged 51-day sideways range. The move pushed price above the prior daily high, which also aligns with an important yearly level and key horizontal resistance, so this area is now our main reference for confirmation. Our naked technical analysis framework focuses on market structure, support resistance and Fibonacci levels to contextualise the current move.
TOTAL daily chart January 13 2026 showing breakout above daily high from 51-day range with key support, resistance and Fibonacci levels.
Technical analysis
- after 51 days sideways movement within the same daily range, we saw the index breaking out above the daily high.
- Rule nr 1 with breakouts : never buy on the breakout. Always wait for confirmation
- So let's wait and see what today brings :
° If we can confirm the breakout and stay above the daily high/yearly level, we might see bullish continuation.
° If we pull back into the range, we might see a retest of the 3.04T region again. The last candle is a high volume candle, very impulsive. A lot of buyers were left behind. It's possible that we see some bearish correction first. - But as usual : the index doesn't have to do anything. The index will do what it needs to do. We have to react accordingly.
- At this moment we see a bullish breakout, which is a first break of structure. It is a switch of momentum, but still no switch of trend. This could still turn out to be a second fake out. As boring as it might be, we wait for today's candle to develop.
Market Structure Analysis
Market structure on this TOTAL daily analysis shows a clear ascending base from the November low around 2.73T, respecting a rising trendline while holding above the range mid. The breakout above the capped daily high/yearly level near 3.17T–3.21T marks the first clear break of structure to the upside: momentum shifts bullish, but the higher-timeframe trend has not flipped yet. The last daily candle is large and impulsive with high volume, suggesting aggressive buying and potential trapped buyers if price quickly reverts back into the prior range. Given the previous fakeout above the same region, confirmation via today’s close is crucial before we can treat this as a genuine expansion leg rather than another liquidity grab.
Key Levels and Scenarios
Bullish scenario: if price can hold above the prior daily high/yearly level and build acceptance there, we anticipate continuation toward the next resistance band and higher Fibonacci projection zones, with upside potential of several percent from current levels before major overhead supply.
Key levels to watch:
3.21T daily high / yearly level: breakout line; needs to hold as support for bullish continuation.
3.18T–3.17T intraday shelf: short-term support; failure here often signals a move back into the range.
3.04T region: prior demand and key support; potential retest area if the breakout fails.
2.99T Fibonacci cluster: deeper corrective target inside the structure if sellers regain control.
2.73T daily low: major downside invalidation; loss of this level would negate the entire bullish structure.
Trading Implications
From a trading perspective, our technical analysis suggests respecting “no buying on the breakout” and instead waiting for either a clean retest/hold above 3.17T–3.21T or a corrective move back toward 3.04T–2.99T that offers clearer risk/reward; any entries should define stops beyond key support and be sized conservatively given the risk of a second fakeout.
This is not financial advice; always do your own research and manage risk accordingly. The structure of this analysis follows our internal trade plan framework