


In this TOTAL daily analysis for 14 December 2025 we focus on how the index reacts to the current “substantial area” around 2.98T–2.9T, defined by the prior institutional candle and key support resistance. Our technical analysis follows the naked trading approach used on the Croesus platform.
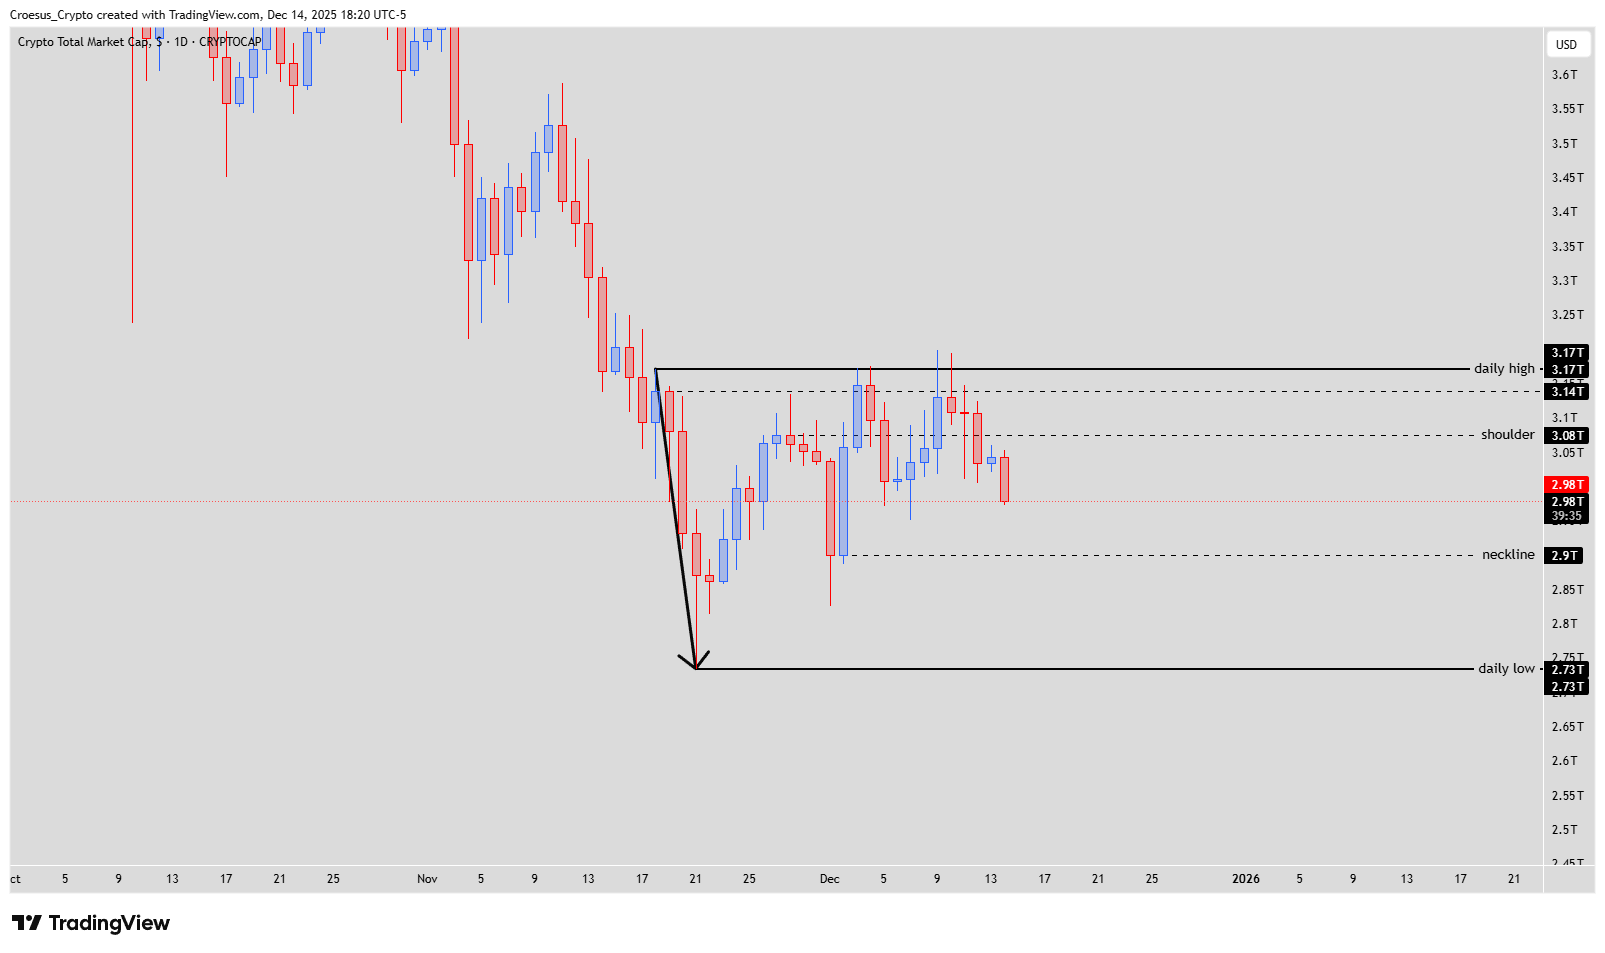
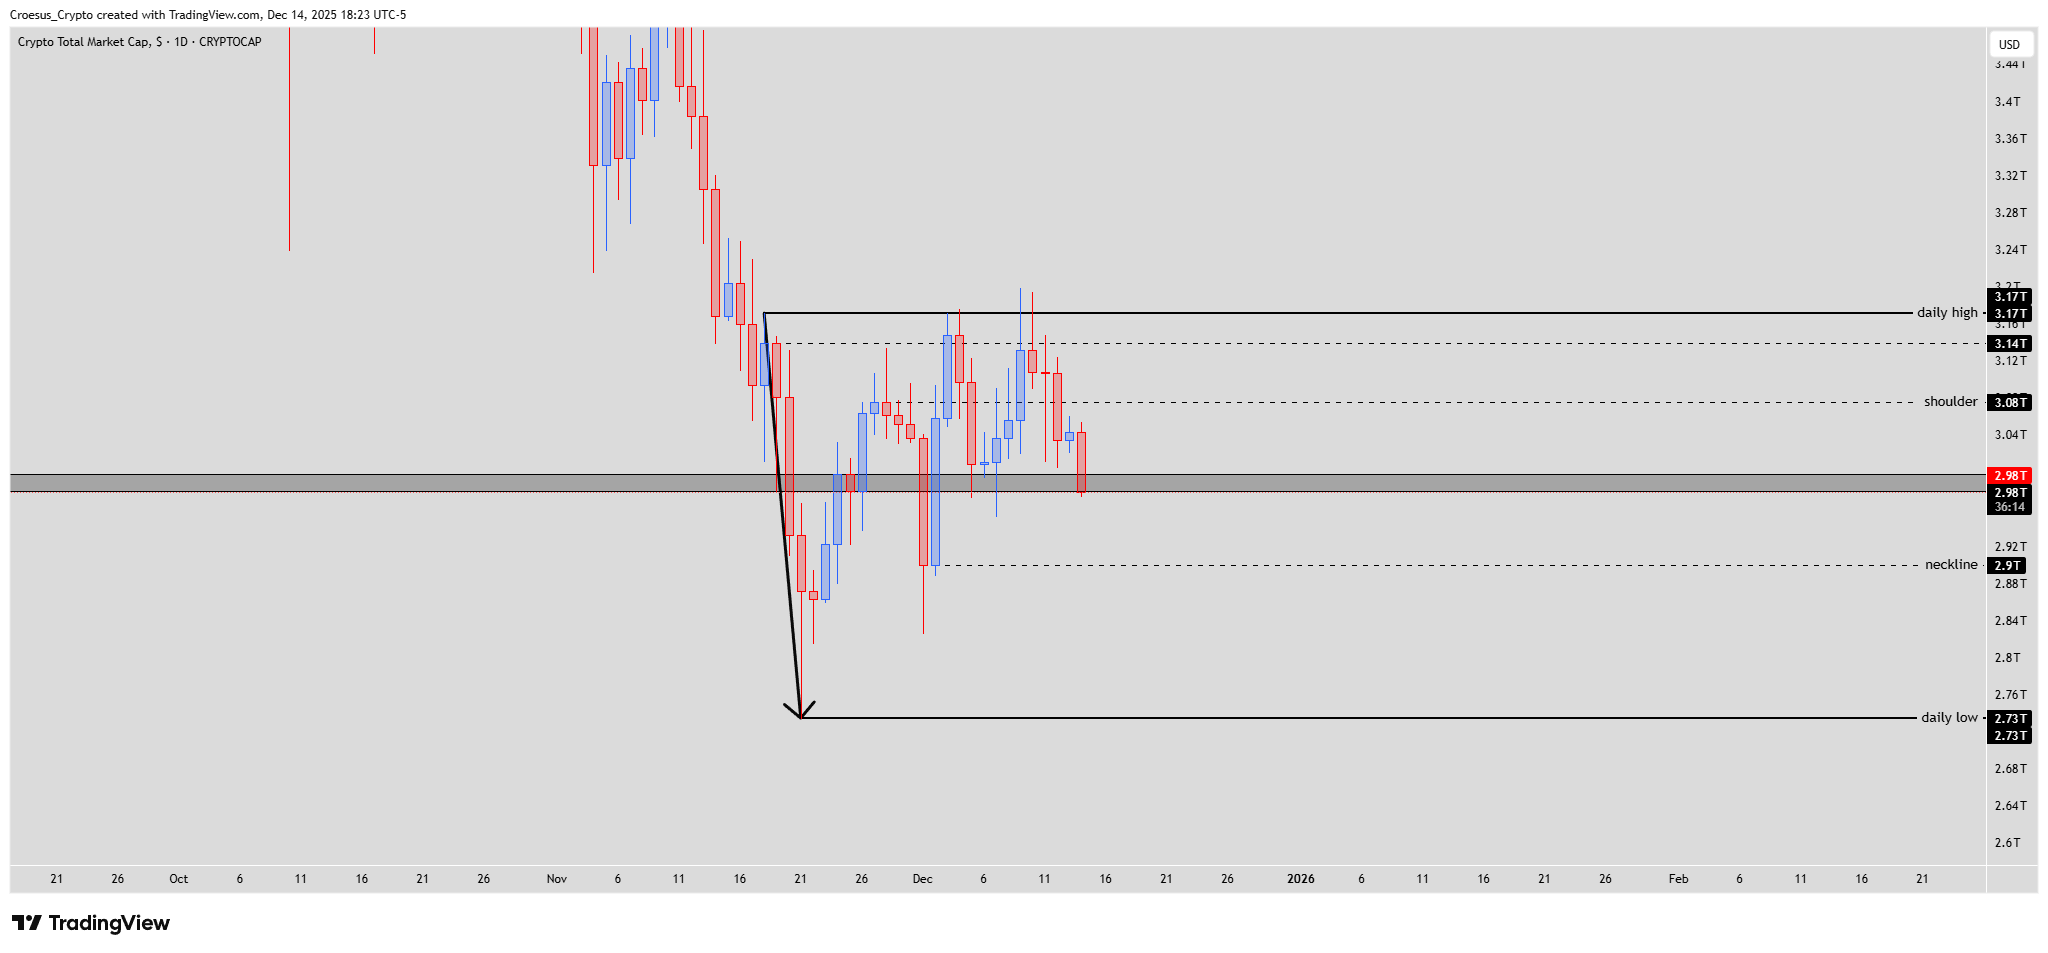
TOTAL daily chart 14 Dec 2025 zooming in on current range between 3.17T daily high, 3.08T shoulder, 2.98T price and 2.9T neckline.
Technical analysis
- After the drop on Friday the index consolidated a little, but made a substantial drop today into a substantial area.
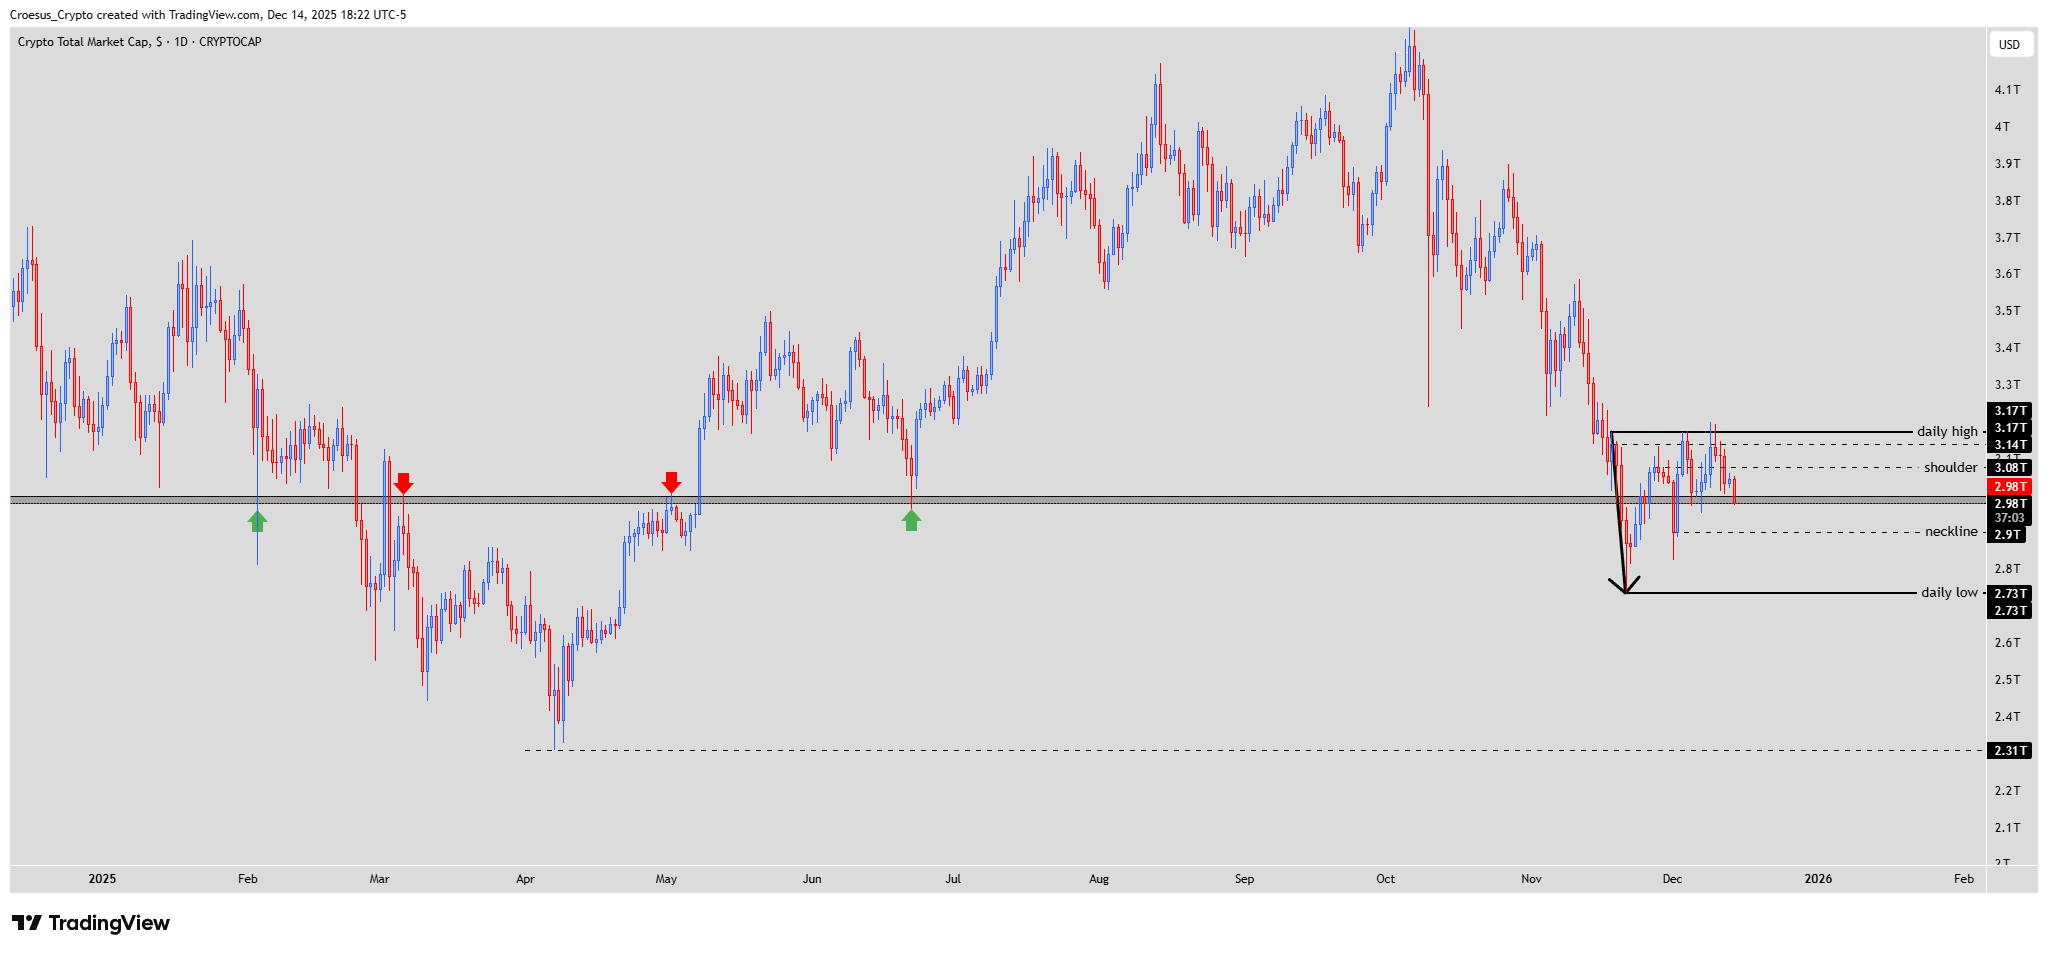
- That substantial area is defined by the institutional candle which we discussed already in previous analysis.
- If we look back, we can clearly notice that this area has been used as a strong buy and sell area.
- If we can close this candle above it, this could confirm this level as support.
- If not, than the possible inverse head and shoulder is invalid, and we look only at the head and shoulder pattern.
Market Structure Analysis
This TOTAL daily analysis shows price extending last week’s impulsive sell-off straight into the institutional candle zone around 2.98T–2.9T. Historically this band acted as both support and resistance, creating a major liquidity pool and key support resistance flip.
The current drop tags that area after a sharp vertical leg, which often invites at least a corrective bounce if buyers defend.
Structurally, bulls are trying to build an inverse head and shoulder off the recent low, but that only remains valid while daily closes hold above the neckline region. A decisive close back below the 2.9T neckline would shift focus to the broader head and shoulder pattern, favouring continuation lower.
No clear Fibonacci confluence is required here; the price action around this institutional candle is the main signal in our technical analysis.
Key Levels and Scenarios
Bullish scenario: a strong daily close back above ~2.98T with follow-through reclaiming the 3.08T shoulder opens room toward 3.14T–3.17T daily high, roughly a 5–7% move from the neckline area.
Key levels to watch
3.17T daily high: major upside target if buyers fully reclaim control.
3.14T micro resistance: interim cap inside the range.
3.08T shoulder: pivot; reclaiming it strengthens the bullish inverse H&S scenario.
2.98T–2.9T institutional zone / neckline: decision area between support and breakdown.
2.73T daily low: key downside objective if the bearish H&S plays out
Trading Implications
For active traders, the institutional zone is a high-interest area, but we prefer waiting for a clear daily close: above 2.98T for long setups with invalidation below 2.9T, or below 2.9T for shorts toward 2.73T, sizing positions conservatively given the volatility.
This is not financial advice; always do your own research and manage risk accordingly. The structure of this analysis follows our internal trade plan framework