


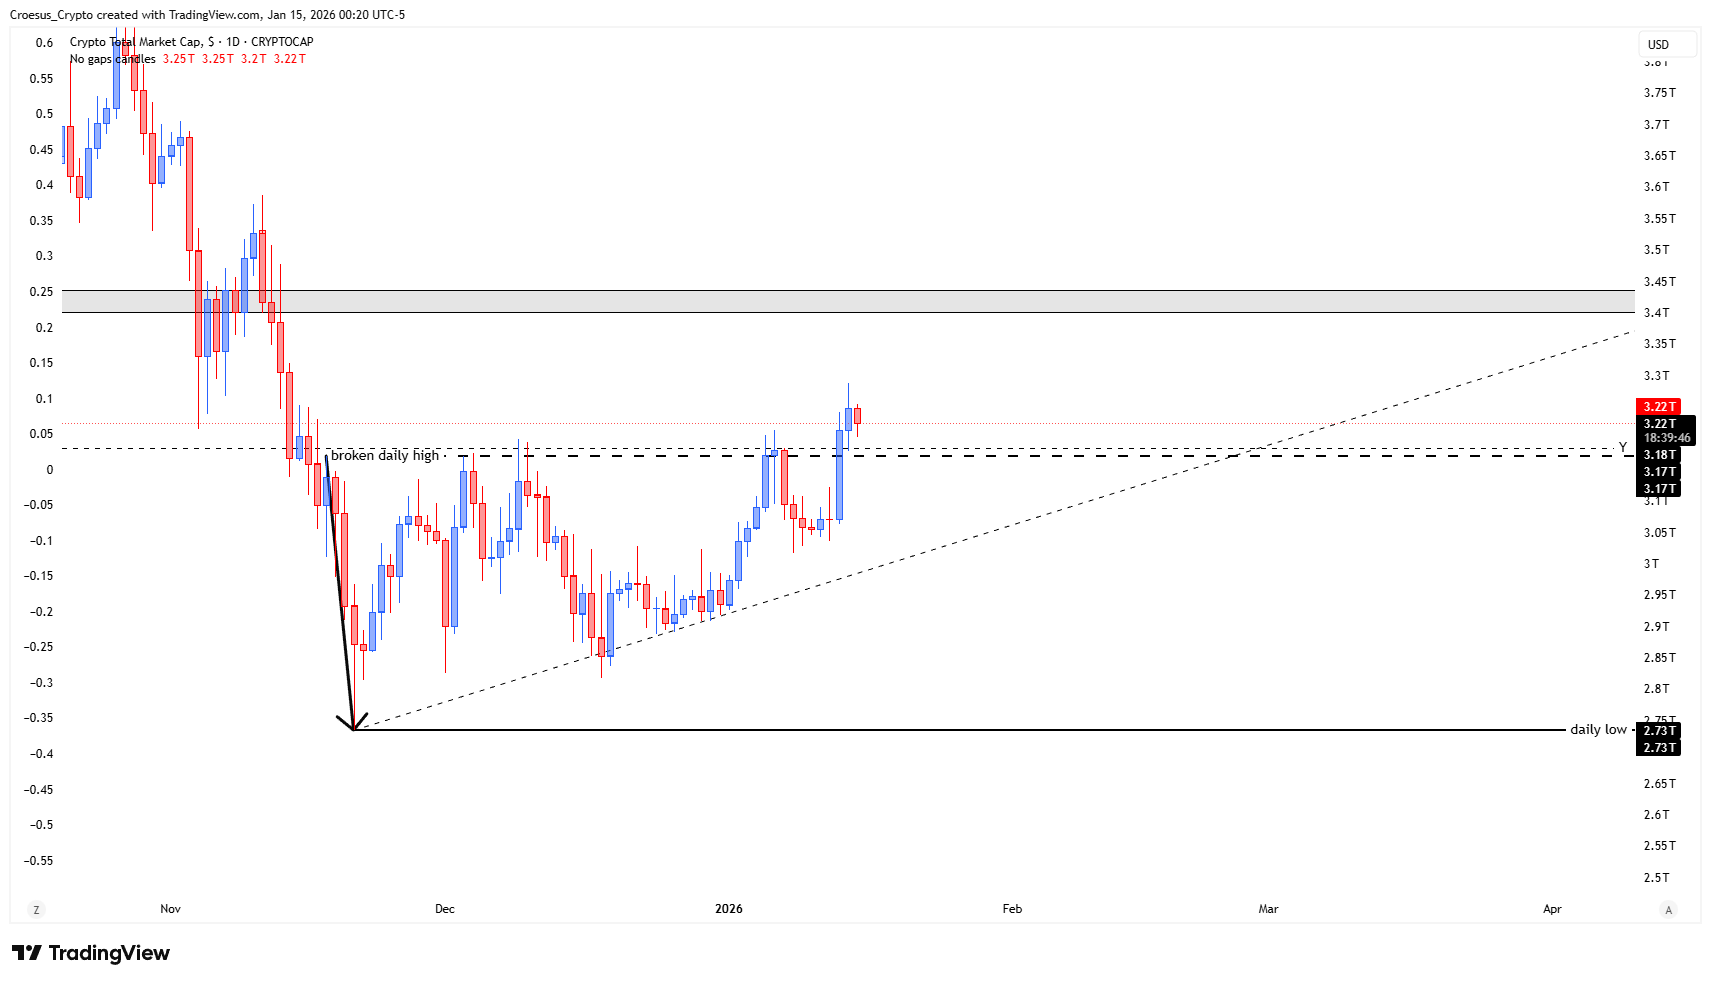
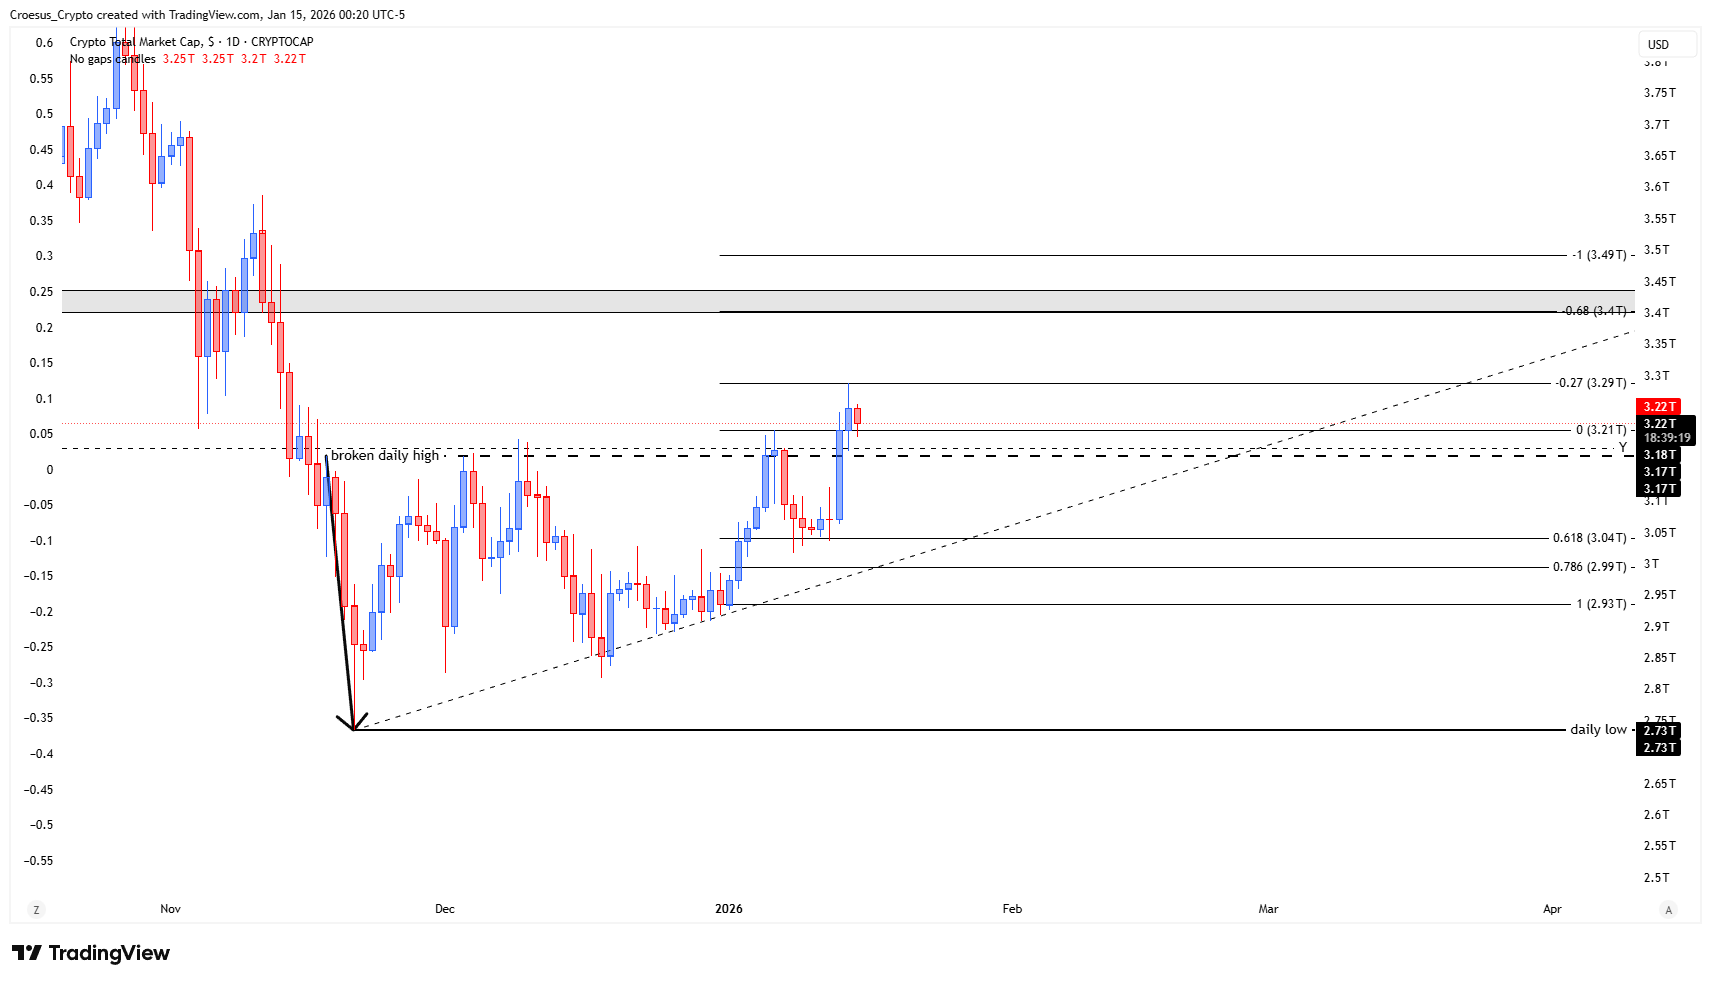
In this TOTAL daily analysis for 14 January 2026, we see the total crypto market cap breaking out of its former daily range and moving above the previous daily high. Price has reached the Fibonacci -0.27 completion area, where some short-term relief is now likely according to our technical analysis.
TOTAL daily chart January 2026 with breakout above daily range, Fibonacci -0.27 extension and nearby resistance zones.
Technical analysis
- after we saw the index break out of its daily range and past the daily high, we saw the index touch the fib -0.27 completion. Therefore some relief might be expected.
- As the prior candle was quite impulsive we expect the relief to be until the low of this candle.
Market Structure Analysis
Our TOTAL daily analysis highlights a clear shift in structure: the market broke cleanly above the prior daily high, confirming a bullish continuation out of the recent consolidation range. The move into the Fibonacci -0.27 extension suggests the first upside objective of this leg has been met. When a breakout candle is this impulsive, it often acts as a "range anchor": any relief or pullback tends to probe back toward its low before trend continuation.
The broken daily high now acts as initial support/resistance flip, with the low of the impulsive breakout candle marking the deeper, but still constructive, demand zone. As long as price holds above that low and the rising local trendline from the November bottom, the broader bullish structure remains intact.
Key Levels and Scenarios
Bullish scenario: If buyers step in on a retrace toward the low of the last impulsive daily candle and reclaim the broken daily high on a closing basis, we expect continuation attempts back into and potentially beyond the Fib -0.27 zone, opening room toward the next visible resistance block above.
Key levels to watch:
Broken daily high – first support after the breakout and key support resistance flip.
Low of the impulsive breakout candle – main pullback demand and bullish invalidation level on the short term.
Fib -0.27 completion area – short-term resistance where relief is expected.
Higher resistance block above – medium-term upside target if extension breaks cleanly.
Major daily low around the prior swing bottom – structural invalidation if lost.
Trading Implications
For active traders, the priority is to look for evidence of buyers defending the breakout candle low before considering fresh longs, with stops placed below that level and position sizing kept conservative while price digests the recent impulsive move.
This is not financial advice; always do your own research and manage risk accordingly. The structure of this analysis follows our internal trade plan framework