


TOTAL daily analysis for 15 December 2025 focuses on a critical junction between a short-term bearish continuation pattern and a higher-timeframe potential reversal. Today the index started positive but sold off with the New York open, keeping pressure on support and emphasizing the importance of the developing structure across 3M, weekly and daily charts.
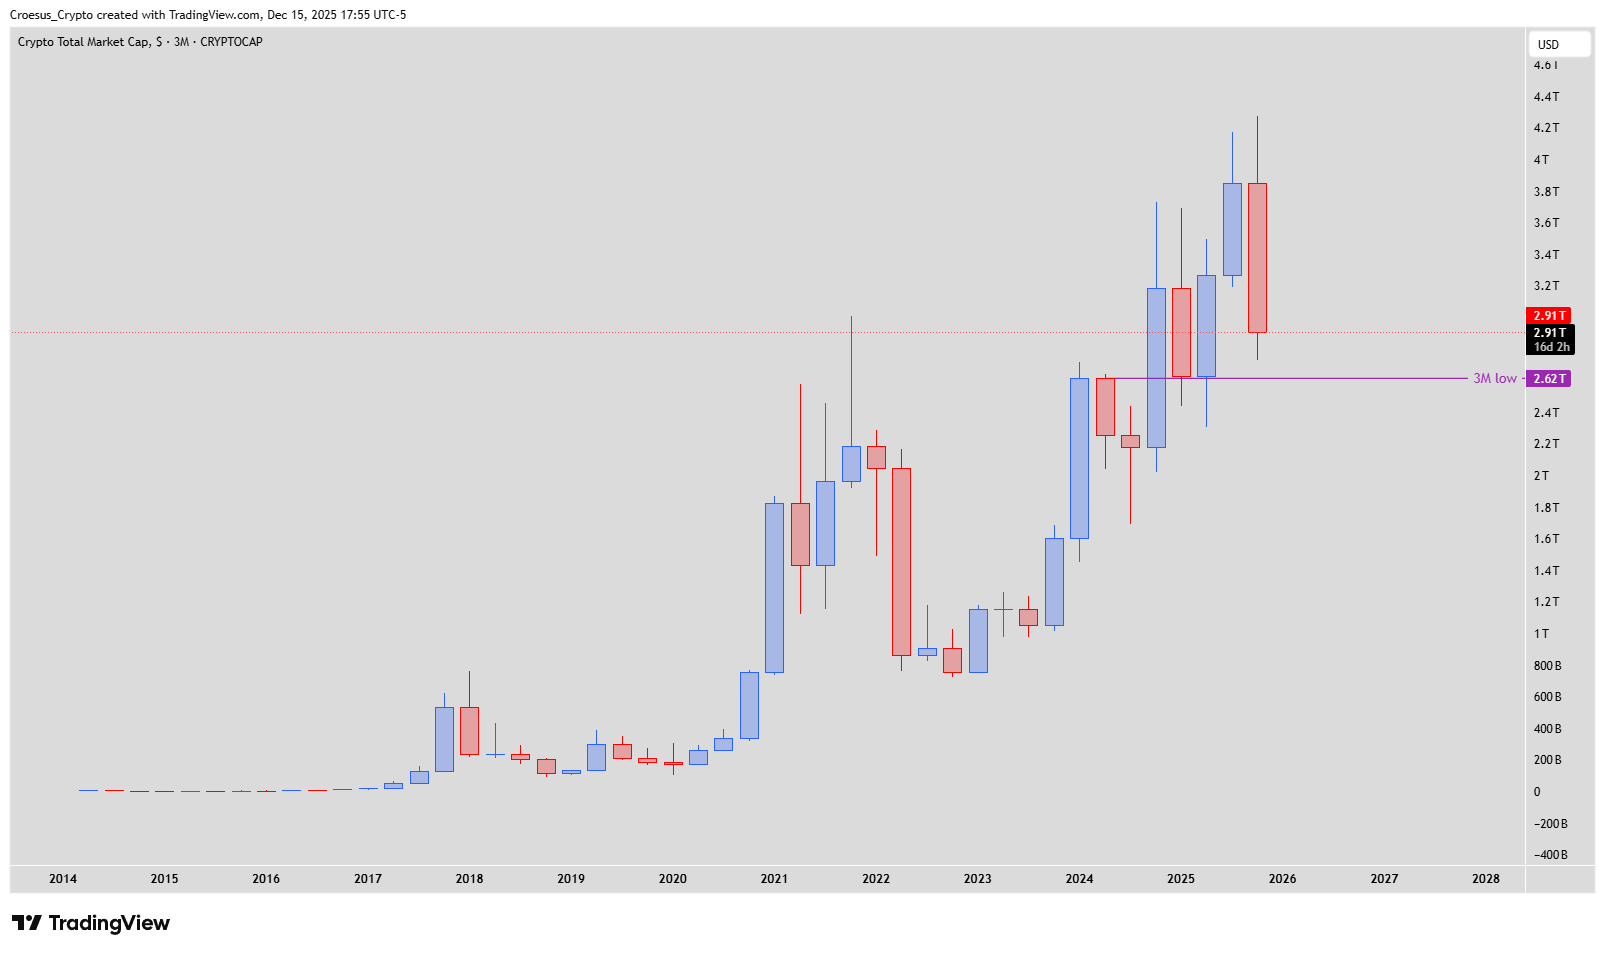
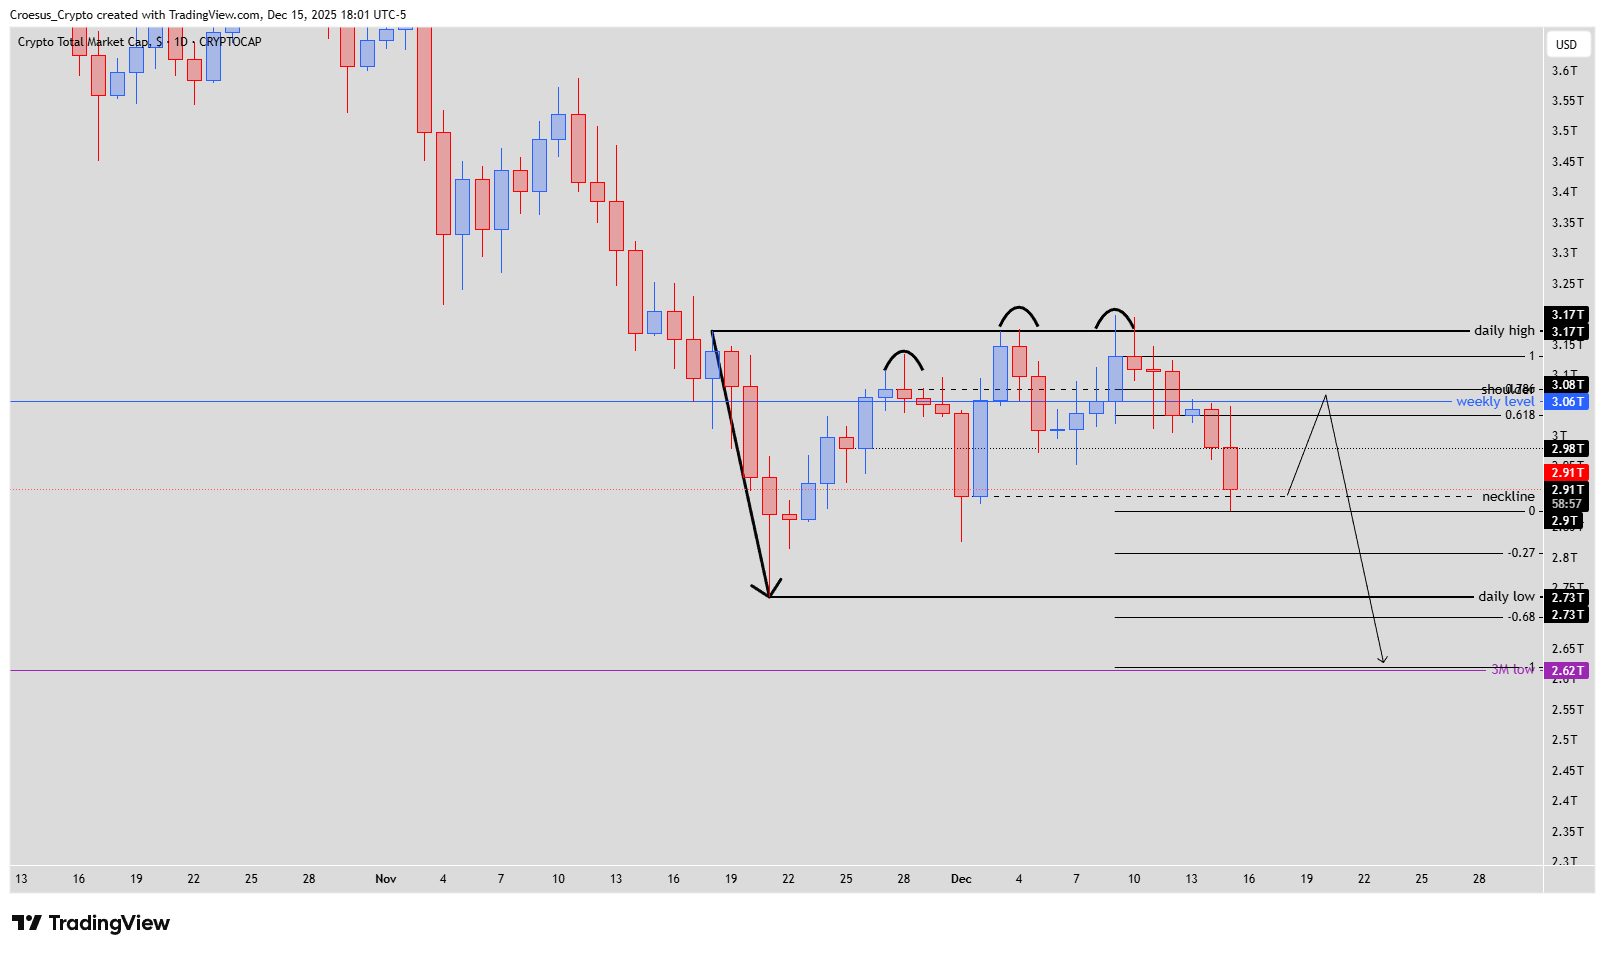
TOTAL 3M chart Dec 15 2025 with impulsive bearish candle and 2.62T 3M low support
Technical analysis
- Today the index started positive but dropped further down with the NY opening.
- As we come in a critical phase of the reversal pattern, we find it necessary to go deeper into the topdown analysis.
- On the 3M chart, the index is printing a very impulsive bearish candle, with the 3M low @ 2.62T that could act as support.
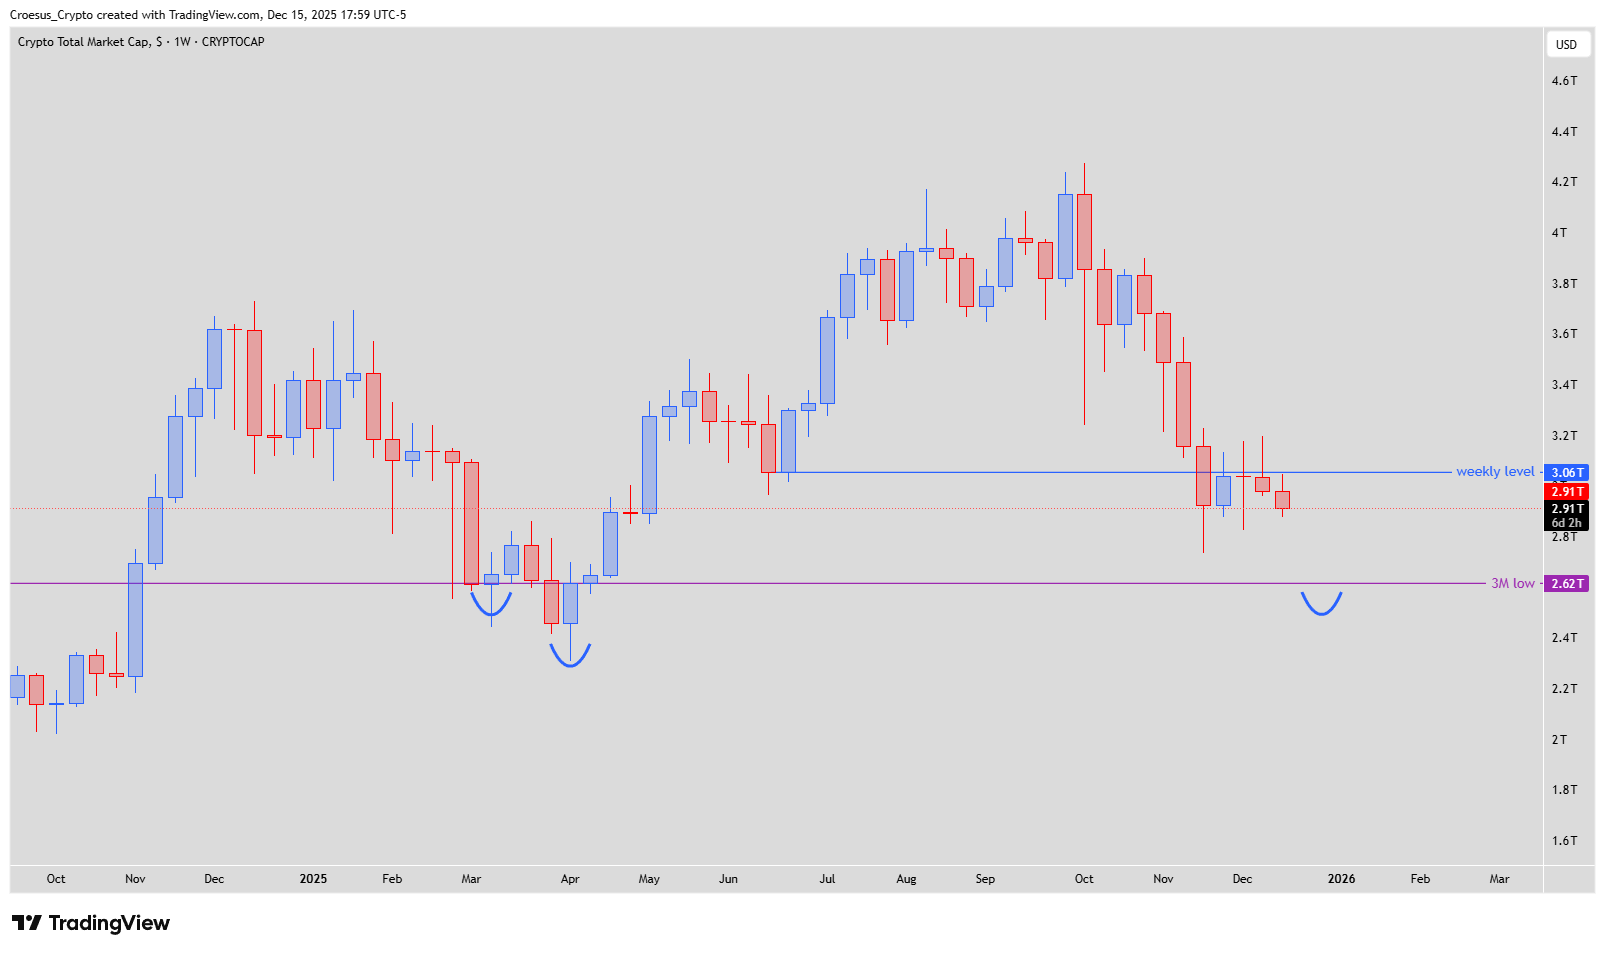
- On the Weekly chart, current resistance is situated @3.06T (weekly level) with a possible inverse head and shoulders pattern around the 3M low, where we could be retesting shoulder 2.
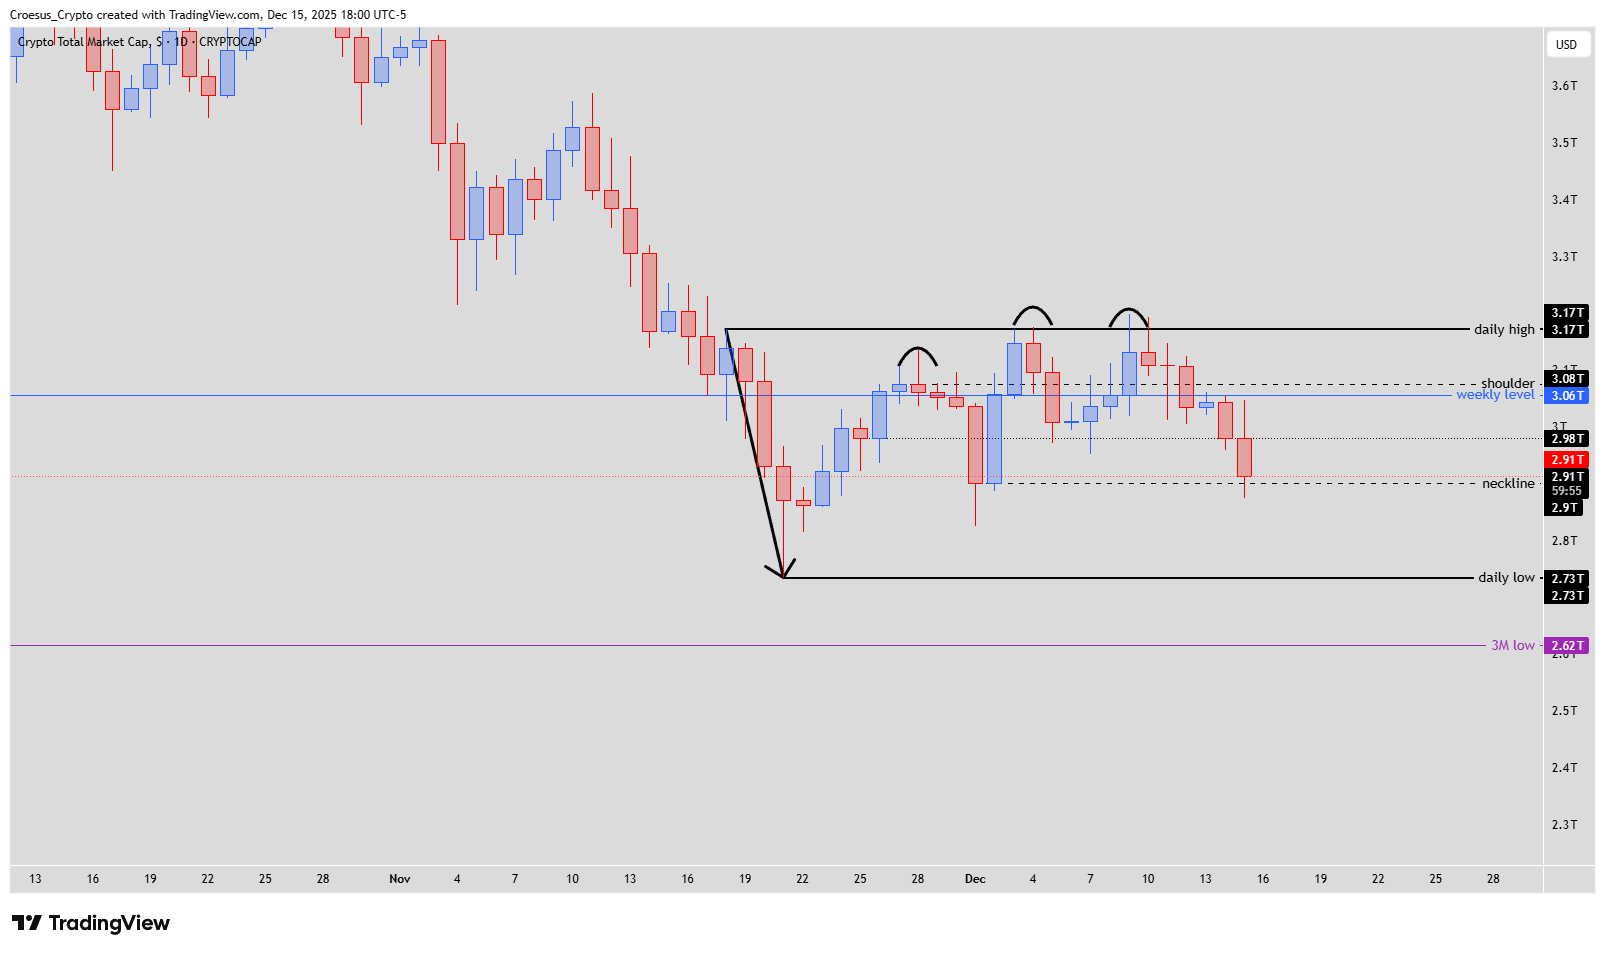
- On the Daily chart, we can clearly see a bearish continuation pattern, a head & shoulders pattern, with the weekly level as resistance level.
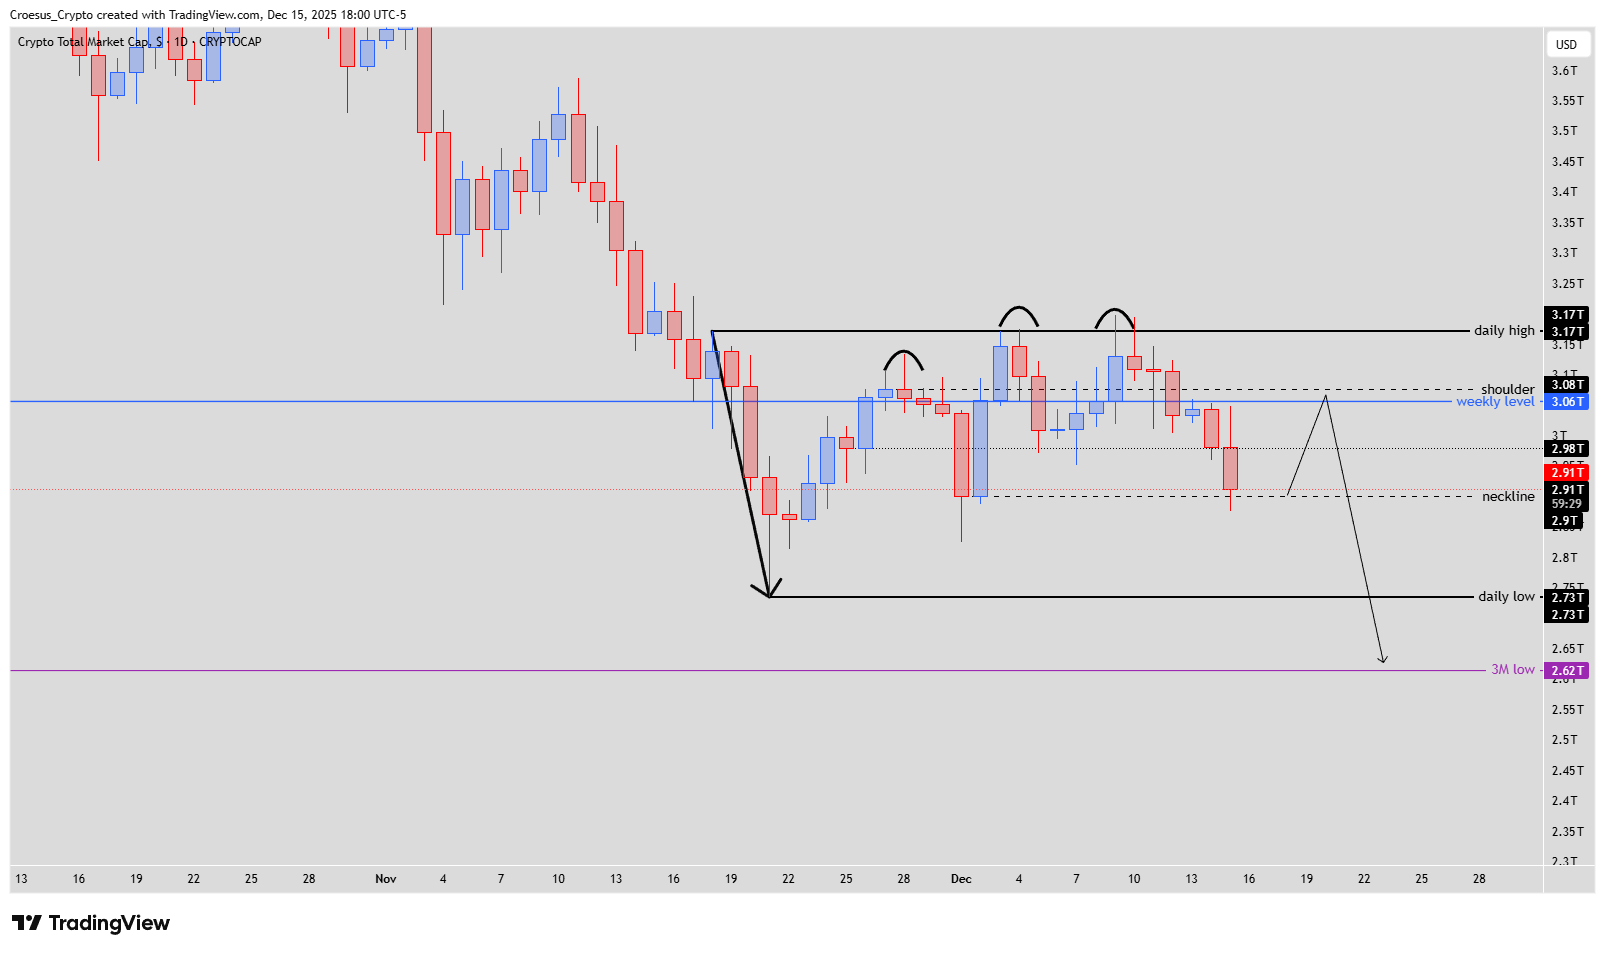
- At this moment we can't have a Fibonacci direction yet; if we take the last candle as the deepest point and assume tomorrow will be bullish again, the 0.786 level is in confluence with the shoulder level and the fib -1 level lines up with the 3M low.
Market Structure Analysis
From a market structure perspective, our TOTAL daily analysis shows sellers firmly in control in the short term. The 3M chart’s impulsive bearish candle suggests macro profit-taking or de-risking, with the 2.62T 3M low as the main structural support that could host a larger reversal.
On the weekly, the possible inverse head and shoulders dating from March 2025 builds a medium-term bullish narrative, but it remains incomplete while price trades below the 3.06T weekly resistance.
On the daily timeframe, technical analysis highlights a clear head and shoulders pattern capped by that same 3.06T level, acting as resistance and confirming local bearish continuation. A breakdown continuation from the daily pattern would aim toward the 2.62T region, where the higher-timeframe support and Fibonacci -1 confluence sit. O
Only a decisive bullish daily candle from current lows, followed by a reclaim of the weekly level, would start validating the potential inverse H&S on the weekly/3M structure.
Key Levels and Scenarios
Bullish scenario (conditional): A strong bullish daily candle from current lows followed by a reclaim and acceptance above 3.06T would weaken the daily head and shoulders, shift local trend, and increase the odds that the larger inverse H&S around the 3M low is forming.
Key levels to watch:
3.06T weekly resistance: Cap of the daily head and shoulders and key “line in the sand” for buyers.
Shoulder level (around 3M low): Potential retest of shoulder 2 on the weekly inverse H&S.
0.786 Fibonacci retracement: Confluent with the shoulder level if a bounce starts from the current daily low.
Fib -1 extension: Lines up with the 2.62T 3M low, reinforcing that zone as major downside support.
2.62T 3M low: Primary structural support and potential reversal area for the entire crypto market cap.
Trading Implications
For active traders, the risk/reward currently favors patience: aggressive shorts are late into support, while longs need a confirmed bullish daily reaction and Fibonacci alignment before considering entries, with invalidation placed clearly below the 2.62T 3M low.
This is not financial advice; always do your own research and manage risk accordingly. The structure of this analysis follows our internal trade plan framework