


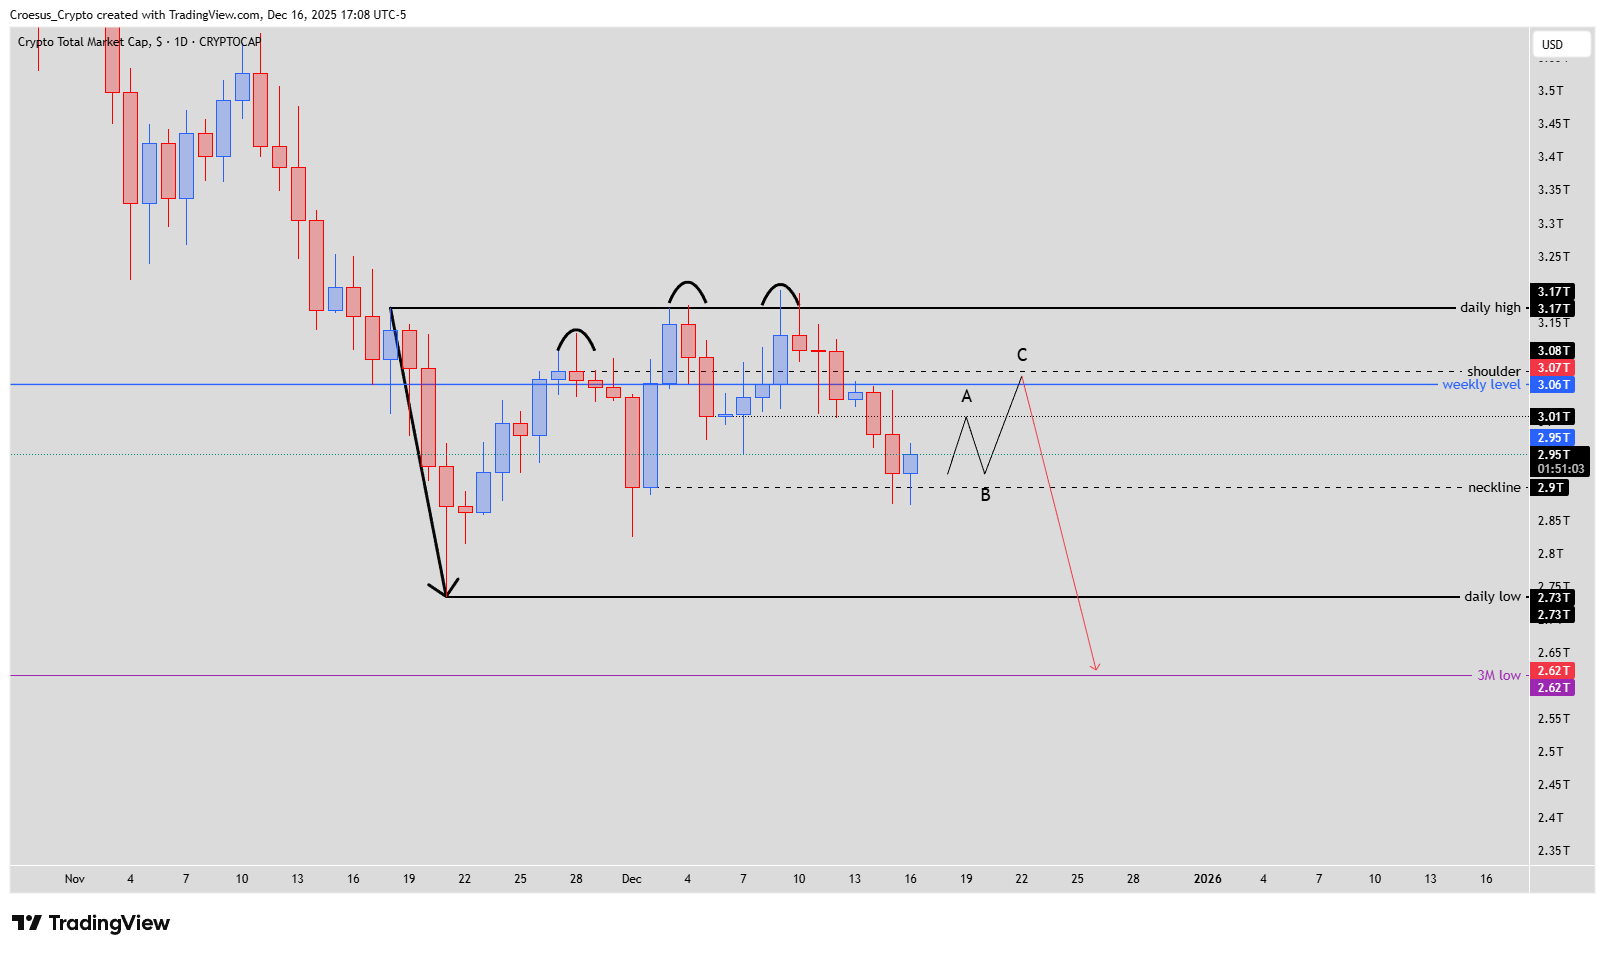
This TOTAL daily analysis focuses on the sharp bearish impulse that set the current trading range and the subsequent corrective structure. Over the last ~25 days, price has been moving inside that range while building a clear head & shoulder pattern that fits a bearish continuation context in our technical analysis.
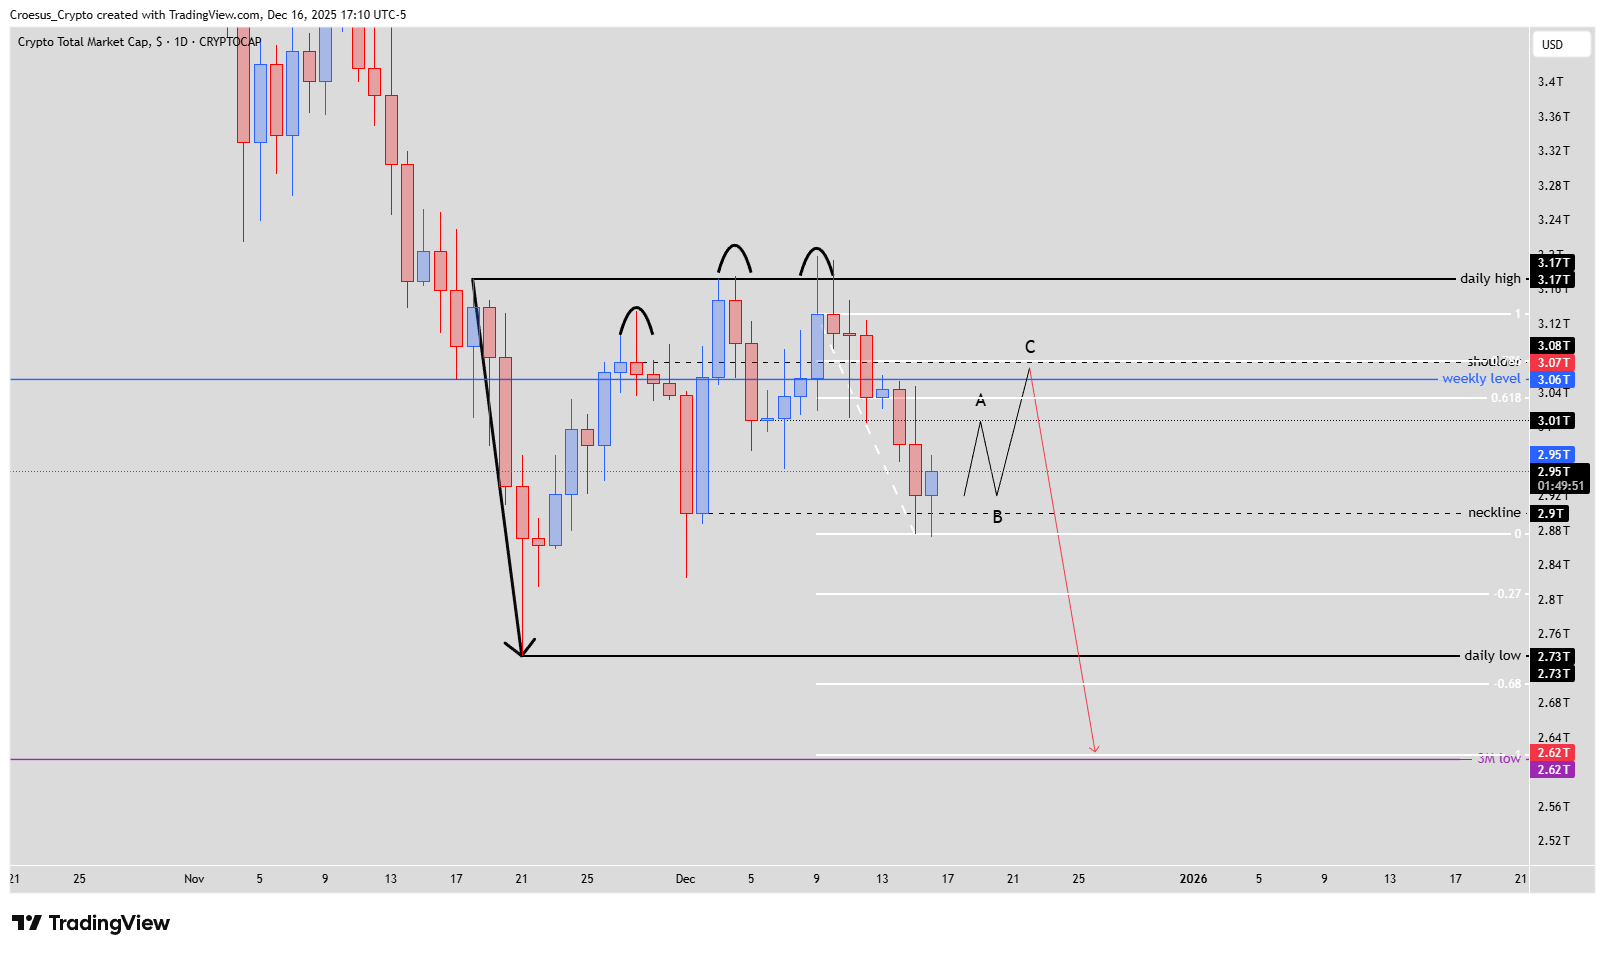
TOTAL daily chart 16 Dec 2025 with impulsive selloff, 25-day range and full head & shoulder pattern
Technical analysis
- a strong impulsive bearish move down of three candles setting the daily range
- a corrective move within the range of, in the meanwhile, 25 days
- formation of a head & shoulder pattern, indicating a bearish continuation
- today a slight bullish reaction after hitting the neckline yesterday
- possible start of a bullish ABC correction towards the shoulder level
- starting a bearish continuation towards the 3M low (confluence with the fib level -1
Market Structure Analysis
The structure starts with a three-candle impulsive bearish move that defines the current daily range between the local low around 2.73T and resistance near 3.17T. This move is clearly impulsive: strong bodies, minimal overlap, decisive break of prior support.
Since then, TOTAL has spent roughly 25 days in a corrective range, moving sideways to slightly up within those boundaries, showing overlapping candles and reduced momentum.
Inside this range, price has carved out a head & shoulder pattern:
a left shoulder at the first rejection near 3.08T,
a higher head into the 3.17T daily high,
and a right shoulder retest of roughly the same 3.08T “shoulder / weekly level” resistance.
The neckline comes in around 2.9T.
Yesterday’s tag of the neckline triggered today’s minor bullish reaction, which we treat as a local relief move rather than a confirmed reversal.
Key Levels and Scenarios
Bullish scenario (corrective): as long as the neckline around 2.9T holds on a closing basis, we can see an ABC corrective bounce back toward the 3.01T–3.08T zone (A–B–C path), retesting shoulder resistance and prior supply. This would remain a corrective move within the larger bearish structure.
Key levels to watch:
3.17T daily high – major resistance, head high of the pattern
3.08T shoulder / weekly level – key resistance and ABC target zone
3.01T – mid-range resistance and potential A-leg cap
2.9T neckline – pivotal support; loss would confirm pattern breakdown
2.62T 3M low / Fibonacci -1 – primary bearish continuation target and strong support confluence
Trading Implications
For now, our TOTAL daily analysis views any bounce toward 3.01T–3.08T as a corrective rally within a broader bearish context, with invalidation above the shoulder region and main downside continuation aiming toward the 3M low / Fibonacci -1 confluence.
Position sizing should respect the wide daily range and place stops outside key support/resistance zones identified by this support resistance framework and Fibonacci levels.
This is not financial advice; always do your own research and manage risk accordingly. The structure of this analysis follows our internal trade plan framework