


TOTAL Marketcap / Crypto Total Market Cap
Our TOTAL daily analysis for 16 February 2026 focuses on a potential ABC corrective structure forming after a sharp leg down. In this TOTAL daily analysis, we apply clean market structure and support resistance levels to frame a countertrend opportunity while respecting the dominant bearish trend in the crypto total market cap. This technical analysis highlights the balance between a possible relief rally and risk of continuation lower.
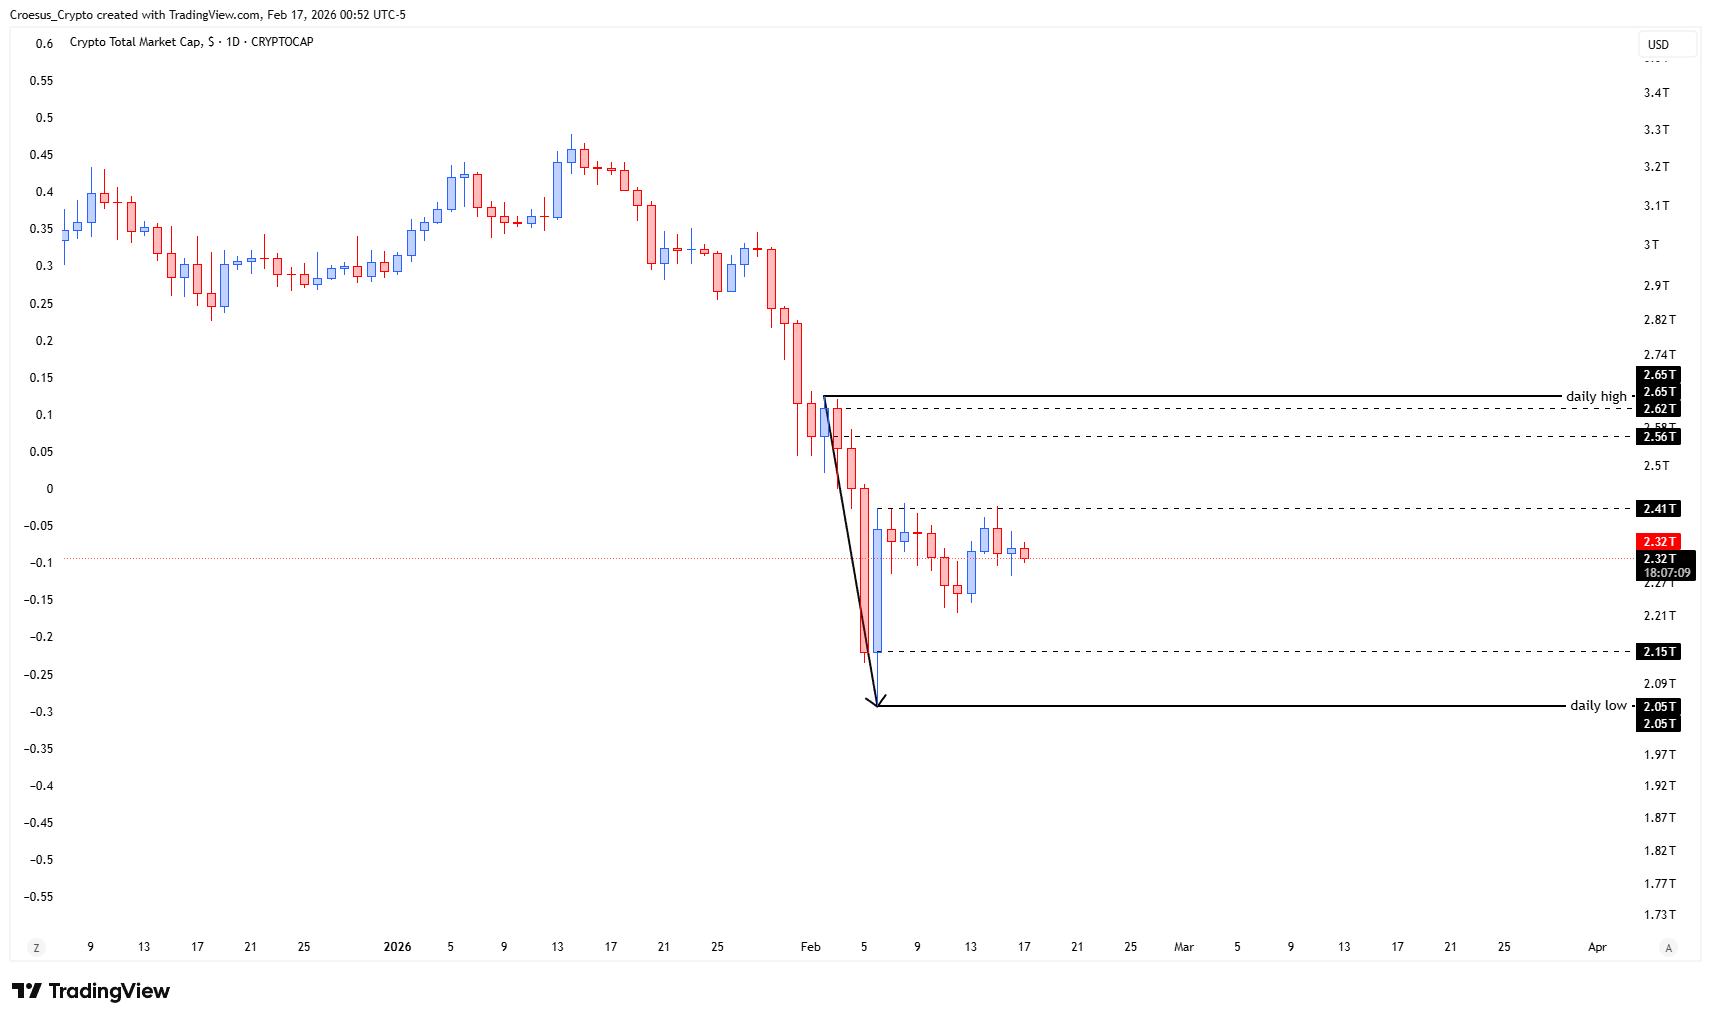
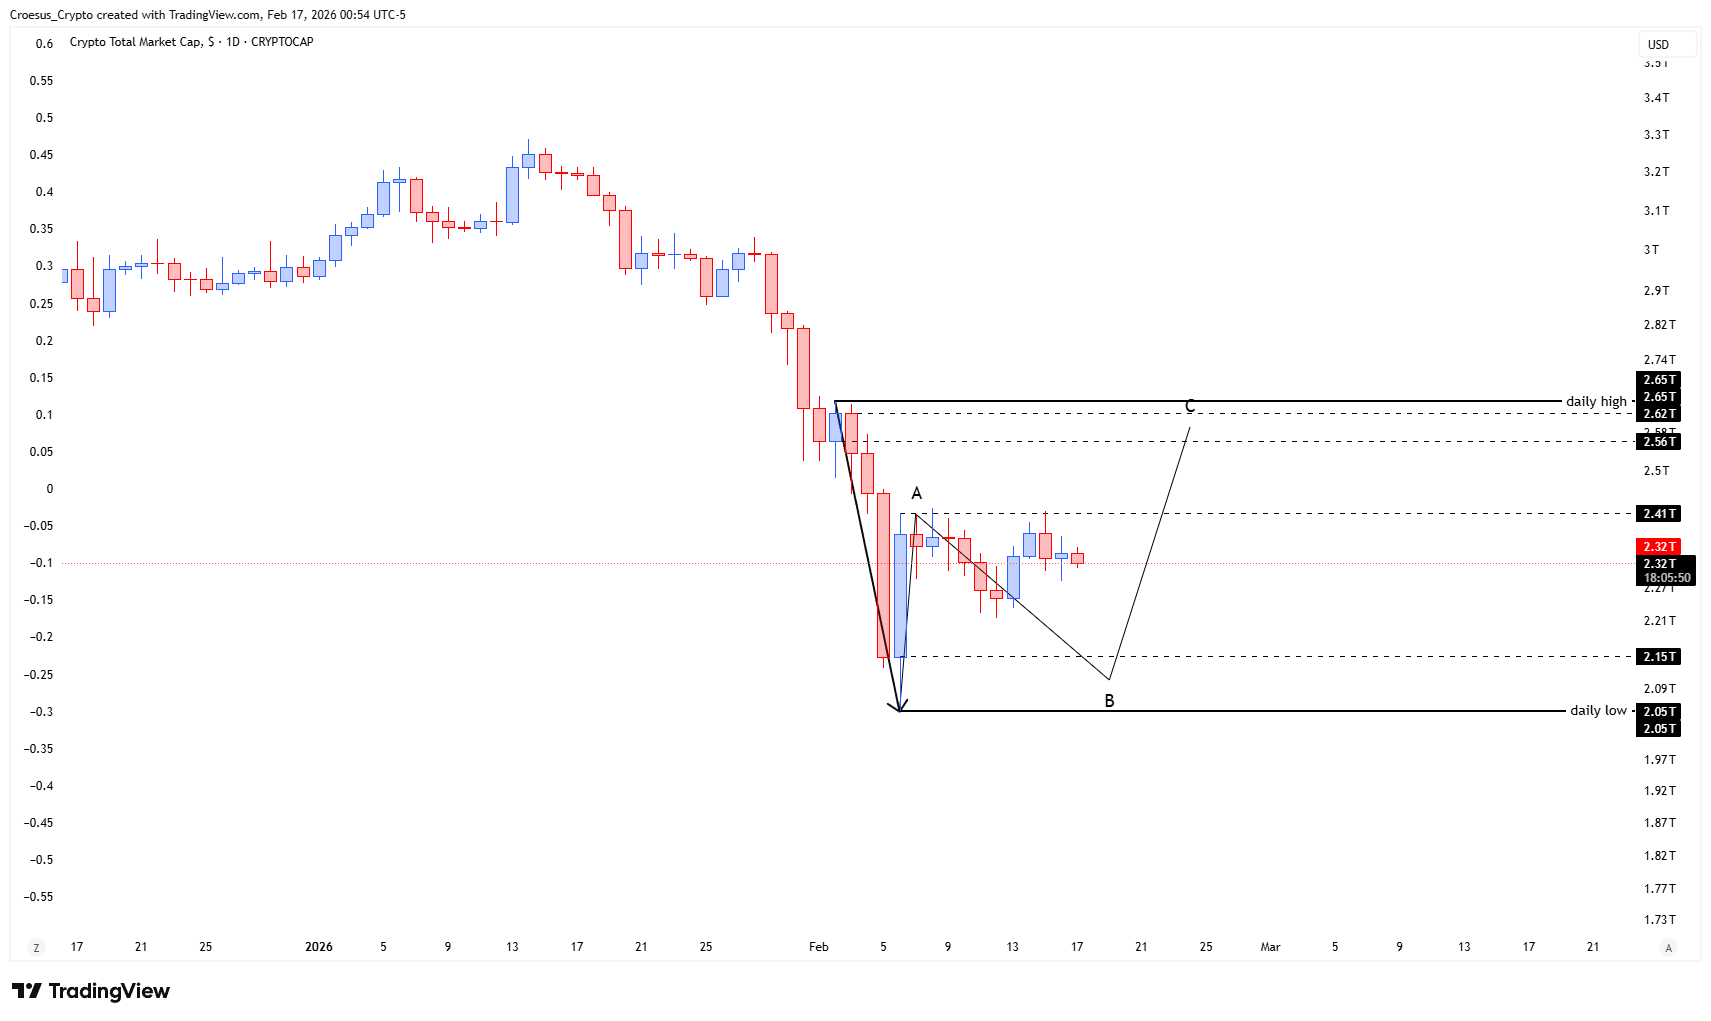
- A possible ABC correction is still in play. The index tried to push higher but never closed past the A-level.
- If an ABC correction plays out, we would see a correction towards the 0-level and then a possible reversal towards the daily high. But be aware : this is a countertrend move. We are still in a bearish leg down. If volume lacks the correction could fail and we could go deeper faster.
Market Structure Analysis
From the strong impulsive selloff into the 0-level zone around the current “B” low, TOTAL entered a sideways corrective phase, failing so far to close above the initial “A” swing high. This supports the idea that an ABC correction is forming within a larger bearish leg. As long as price trades between the daily low near 2.05T and the 2.41T–2.56T resistance band, we treat this as range-bound corrective structure. A clean break and daily close above the A-level and 2.56T resistance would open room for an extension toward the daily high around 2.65T, where traders can look for confluence with potential Fibonacci retracement levels of the prior selloff.
Key Levels and Scenarios
Bullish scenario (countertrend): an ABC completion would likely see a move from the 0-level/daily low zone back toward the daily high near 2.65T, roughly a 25–30% range from the lows, provided volume expands and sellers fail to defend the mid-range resistances.
Critical levels to watch:
- 2.05T daily low / 0-level – major downside pivot; loss reopens deeper bearish continuation.
- 2.15T intermediate support – midpoint of the current consolidation, potential B-leg reaction area.
- 2.41T resistance – first key cap for any bounce; rejection keeps the ABC idea fragile.
- 2.56T resistance – A-level region; daily close above strengthens the C-leg scenario.
- 2.65T daily high – main upside target and likely profit-taking zone for any completed ABC correction.
Trading Implications
For active traders, any long exposure here is strictly countertrend: the cleaner opportunity sits either on a high-probability reaction off the 0-level/daily low or on confirmation above the A-level, with tight stops below recent swing points and reduced position sizing to respect elevated downside risk.
This analysis is for informational purposes only and does not constitute financial advice.