


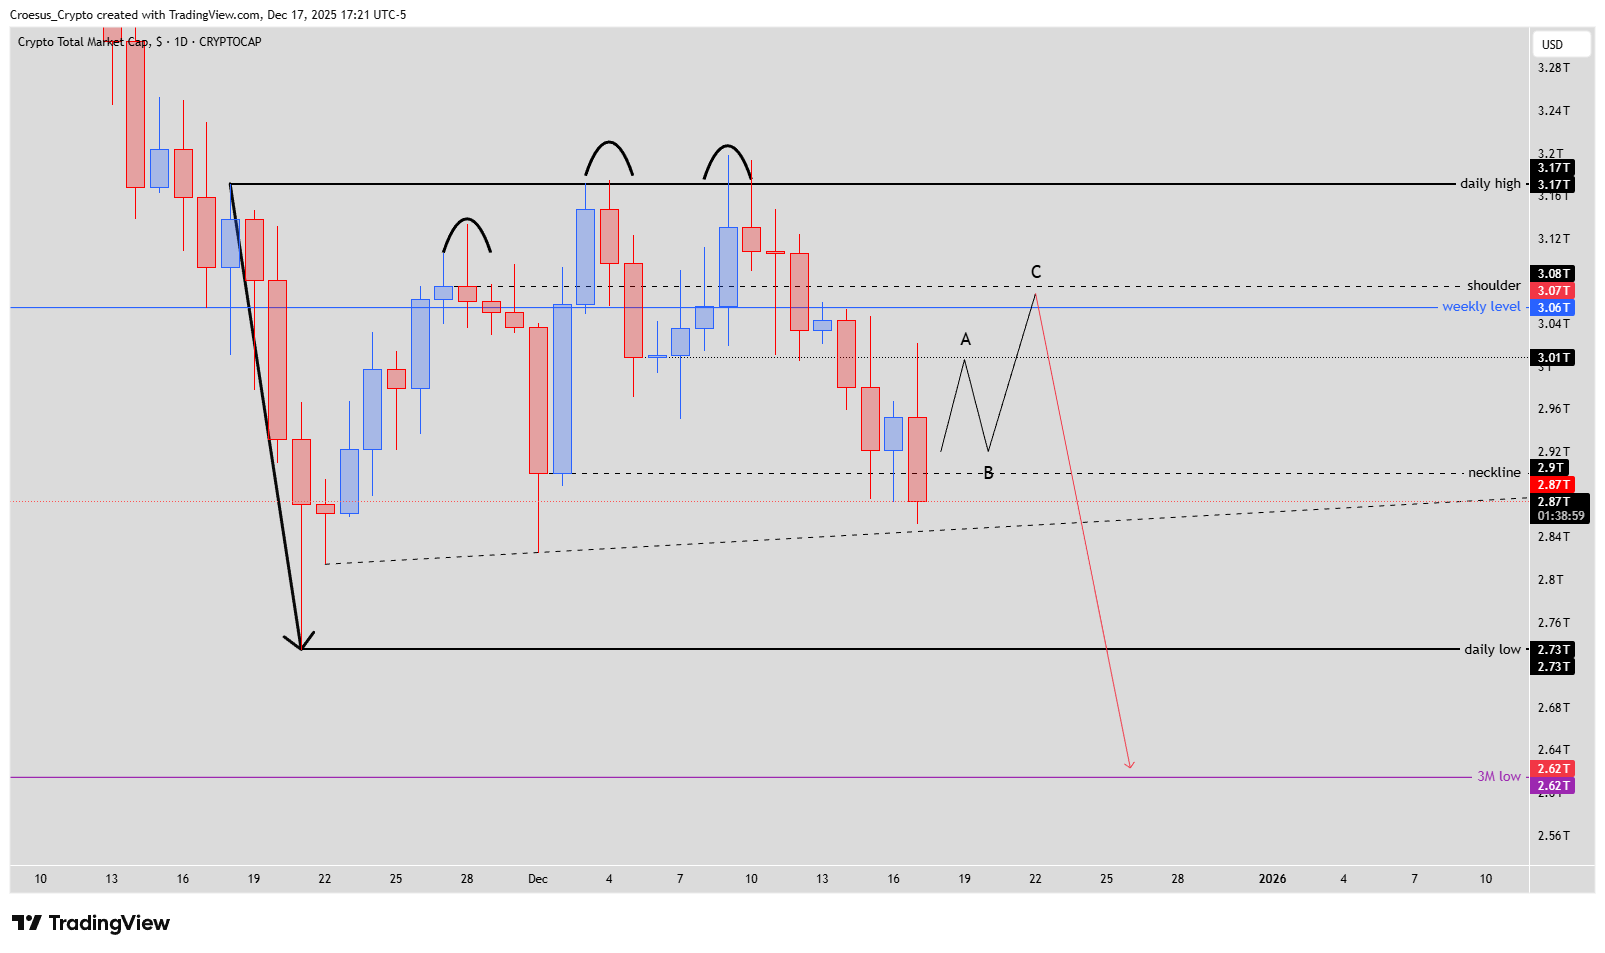
TOTAL daily analysis for 17 December 2025 focuses on a developing head and shoulders structure around the 3.0T region, with price now testing and slipping below the neckline after a failed bounce.
TOTAL daily chart 17 December 2025 with head and shoulders pattern, neckline, trendline liquidity and projected bearish continuation.
Technical analysis
- after tapping the neckline, the index made a impulsive retest of the A-level, but to fall back down to the neckline in the same daily candle, possibly printing the B-leg in the same daily candle.
- at this moment the index is trading below the neckline, but this does not impact the possibility to complete the head and shoulder pattern.
- we can also see some kind of a trendline, creating trendline liquidity below that trendline. This is usual a magnet after an opposing move, so here a bearish magnet after a bullish move up.
Market Structure Analysis
Our TOTAL daily analysis shows a clear head and shoulders pattern forming below the 3.17T daily high, with shoulders around the 3.07–3.08T weekly level and a neckline close to 2.9T.
The impulsive rejection from A back to the neckline within one daily candle underlines strong supply at higher levels and suggests that B may already be in place.
Trading slightly below the neckline keeps downside pressure intact, but as long as price can reclaim 2.9T, a final push toward the shoulder zone (leg C) remains possible before any decisive breakdown.
The visible rising trendline adds a pocket of trendline liquidity underneath; in our technical analysis this often acts as a bearish magnet after a sharp move up, aligning with the head and shoulders risk.
Key Levels and Scenarios
Bullish scenario: Reclaim the neckline and hold above 2.9T, then extend toward the 3.01T–3.08T region (shoulder / weekly resistance) to potentially complete leg C of the pattern.
Key levels to watch
3.17T – daily high and major resistance, invalidates the topping structure if reclaimed convincingly
3.07–3.08T – shoulder / weekly resistance, ideal completion area for leg C
3.01T – interim resistance and pivot inside the pattern
2.90T – neckline area, key support resistance flip for continuation
2.73T and 2.62T – daily low and 3M low, bearish targets if neckline breaks with momentum
Trading Implications
For active traders, risk is skewed lower while below the neckline, with short setups favored on failed retests of 2.9T–3.0T and invalidation above the shoulder region; position sizing should reflect the distance to those clear invalidation levels.
This is not financial advice; always do your own research and manage risk accordingly. The structure of this analysis follows our internal trade plan framework