TOTAL Marketcap / Crypto Total Market Cap
TOTAL daily analysis 17/03/2026. The total crypto market cap index is showing early signs of exhaustion after pushing into a key supply area, and our technical analysis focuses on whether this rejection develops into a broader corrective leg.
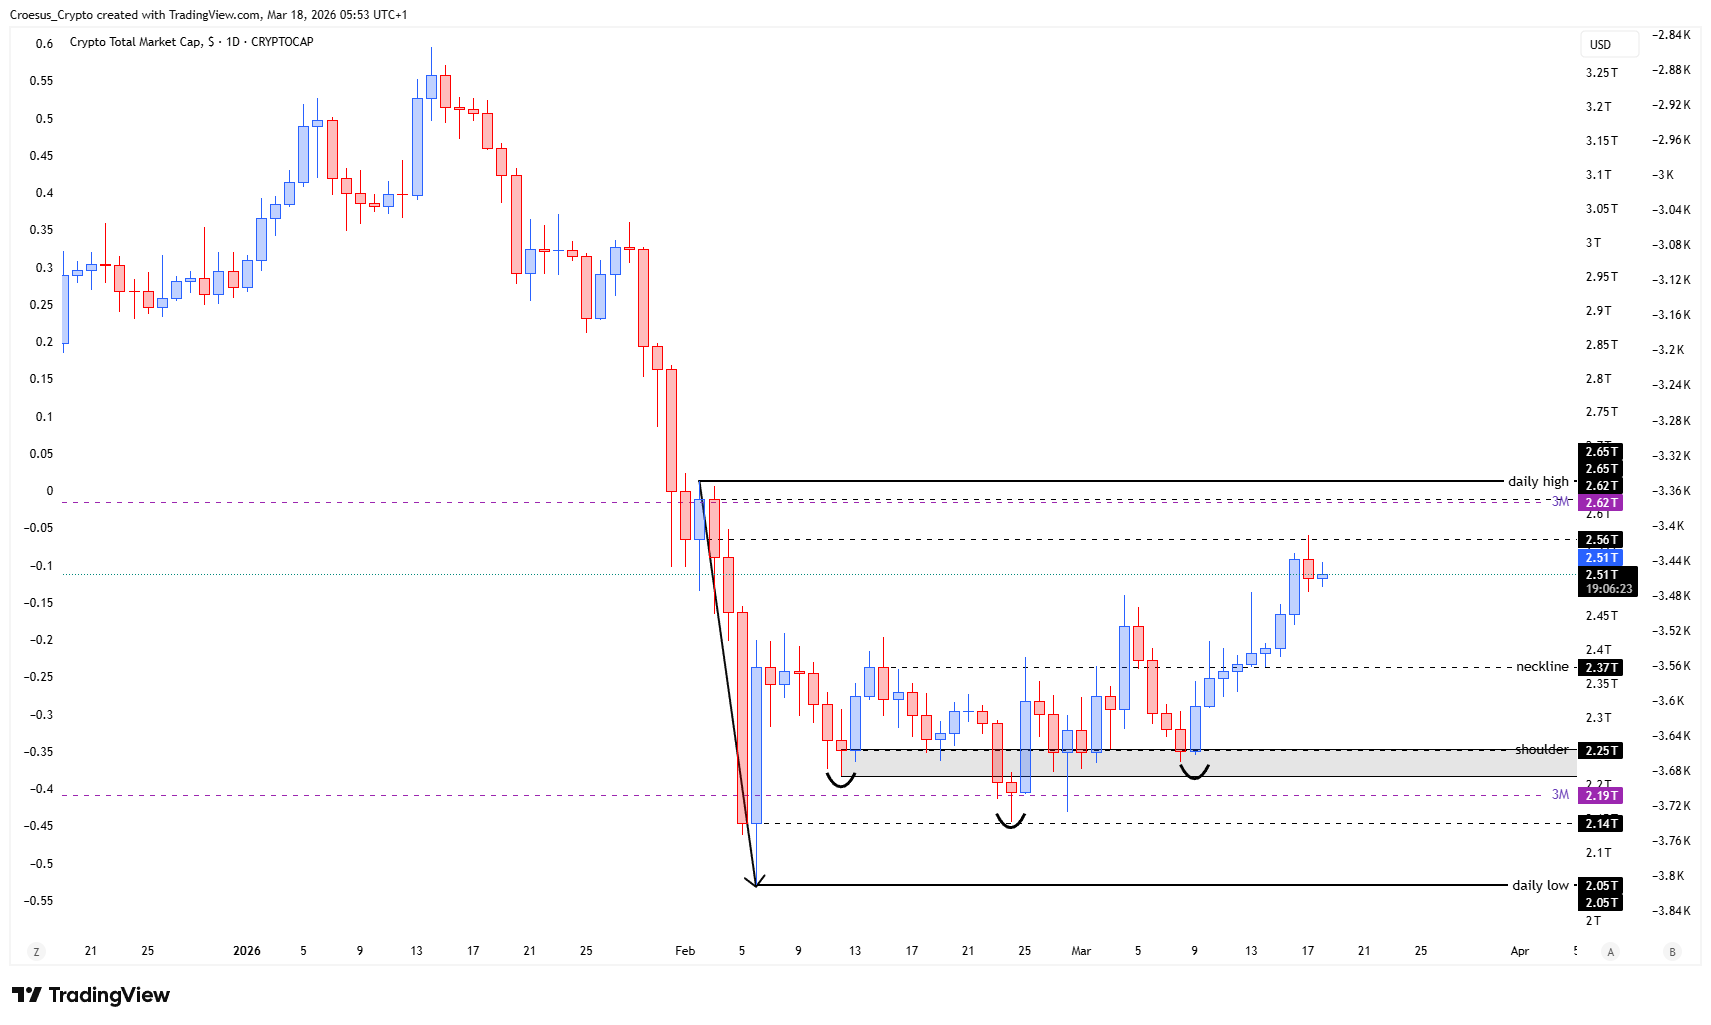
- The index pushed higher into the zone of the institutional candle but got stopped there. It printed the first bearish candle in a sequence of bullish candles, an indicational candle, indicating that we might see a correction.
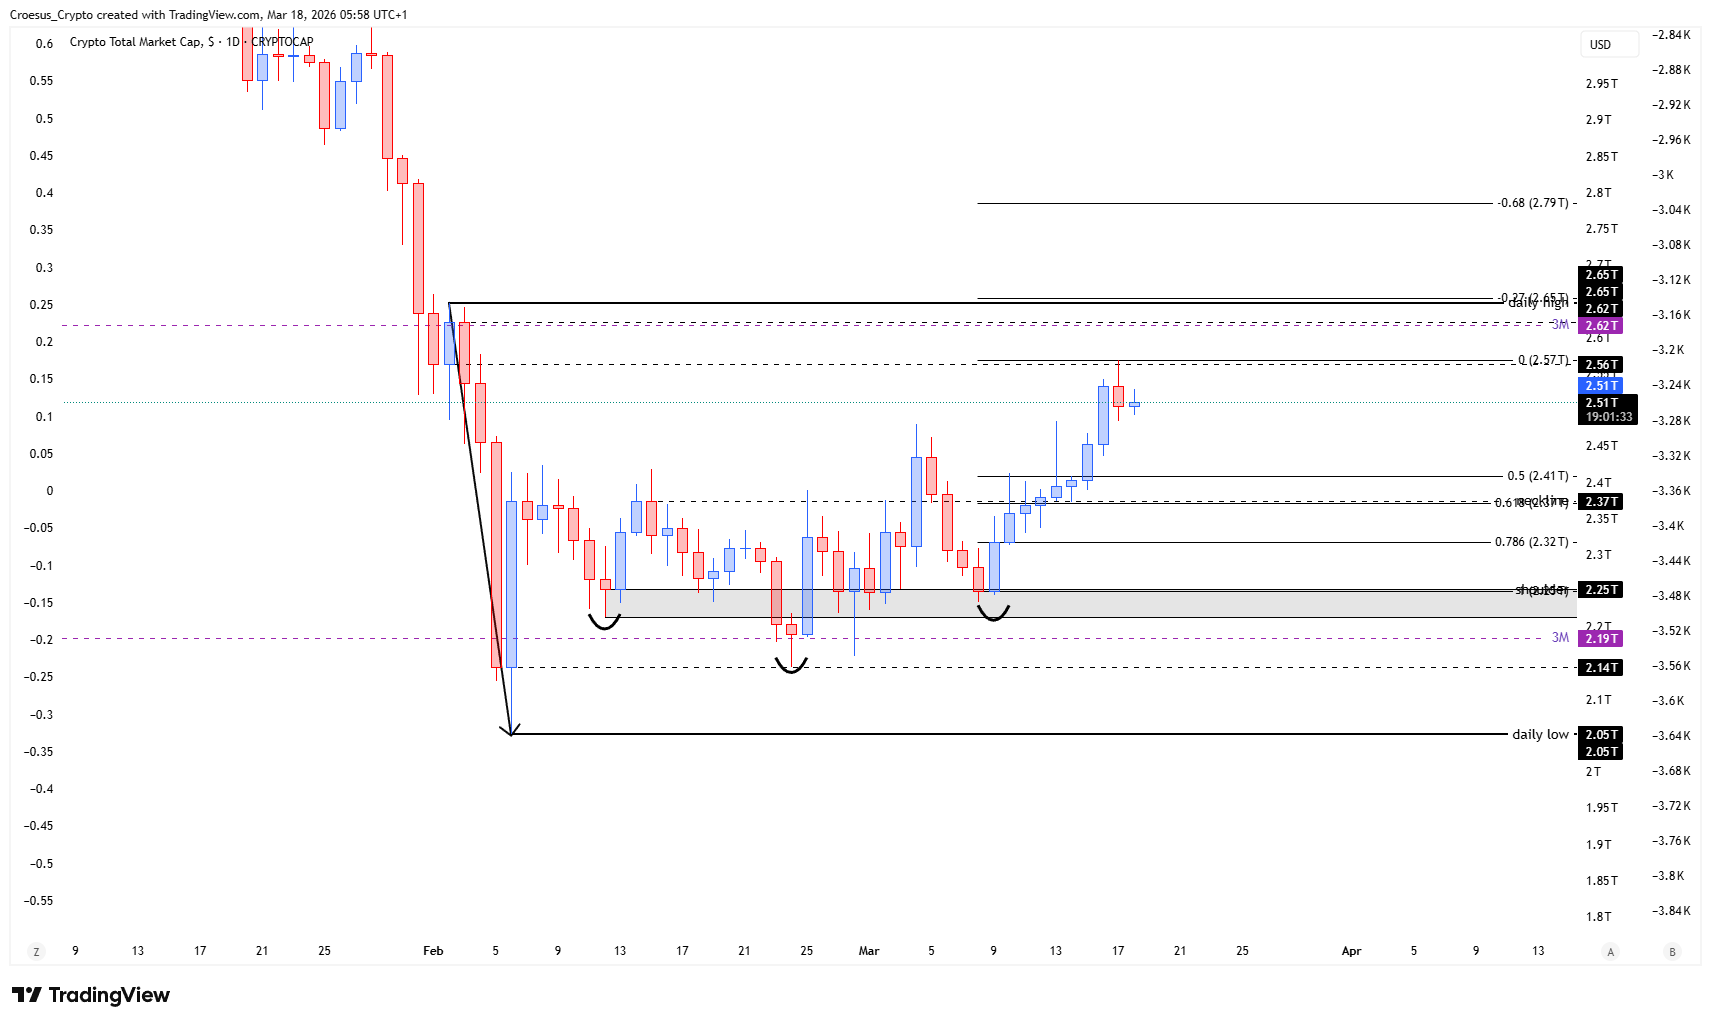
- If we take the Fibonacci retracement from this move up, we can see that the 0.618 level aligns perfectly with the neckline, and the -0.27 aligns perfectly with the daily high.
Market Structure Analysis
From a market structure perspective, price is reacting to a clear horizontal supply zone defined by the institutional candle and the rejection is signaled by the first bearish candle after a sequence of bullish candles.
In naked trading terms, that shift often marks a transition from impulsive continuation into corrective structure, especially when it appears at a prior decision candle zone. The Fibonacci confluence strengthens the support resistance map: the 0.618 retracement aligning with the neckline suggests a technically “clean” downside magnet if selling pressure follows through, while the -0.27 aligning with the daily high reinforces the idea that the recent push may represent a stretched leg into liquidity before a pullback.
Key Levels and Scenarios
In this TOTAL daily analysis, bearish continuation is favored as long as price remains capped by the institutional candle zone, with the neckline/0.618 confluence acting as the primary corrective objective. A bullish invalidation requires reclaiming and holding above the daily high area, reducing the probability of a deeper retracement and shifting structure back toward continuation.
- Institutional candle zone: key overhead resistance where the recent push was stopped
- Neckline / 0.618 Fibonacci: confluence support zone where a corrective move can stabilize
- Daily high / -0.27 Fibonacci: upside reclaim level that would weaken the bearish corrective thesis
Trading Implications
Risk is typically elevated when price is transitioning from impulse to correction, so our focus remains on confirmation around major support resistance and Fibonacci confluence rather than anticipating the next leg. Aggressive participants often look for continuation signals below resistance, while conservative traders usually wait for reaction at the neckline/0.618 before committing to directional bias.
This analysis is for informational purposes only and does not constitute financial advice.