


TOTAL Marketcap / Crypto Total Market Cap
TOTAL daily analysis focuses on the crypto total market cap retesting the same support zone that produced the last bounce. After the strong leg down, price is ranging above the 2.25T area, which acts as the key line in the sand between a constructive consolidation and another downside expansion. Our technical analysis follows the Croesus naked-trading framework focused on clean market structure and Fibonacci levels.
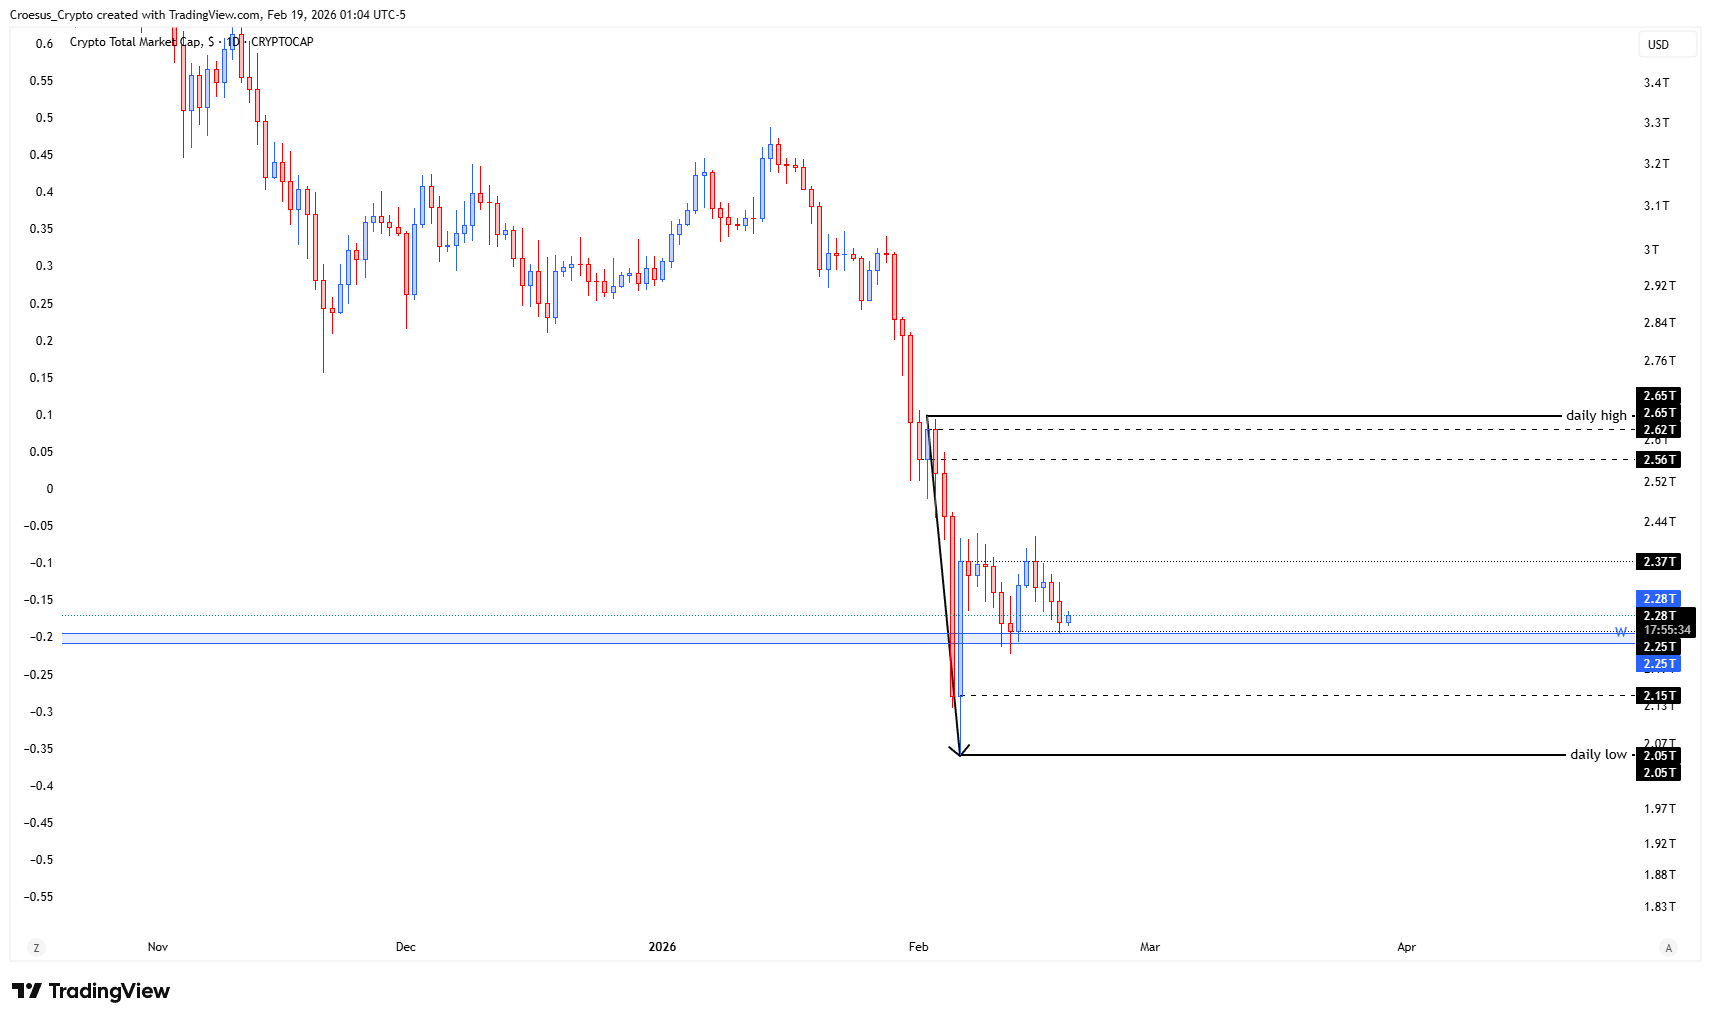
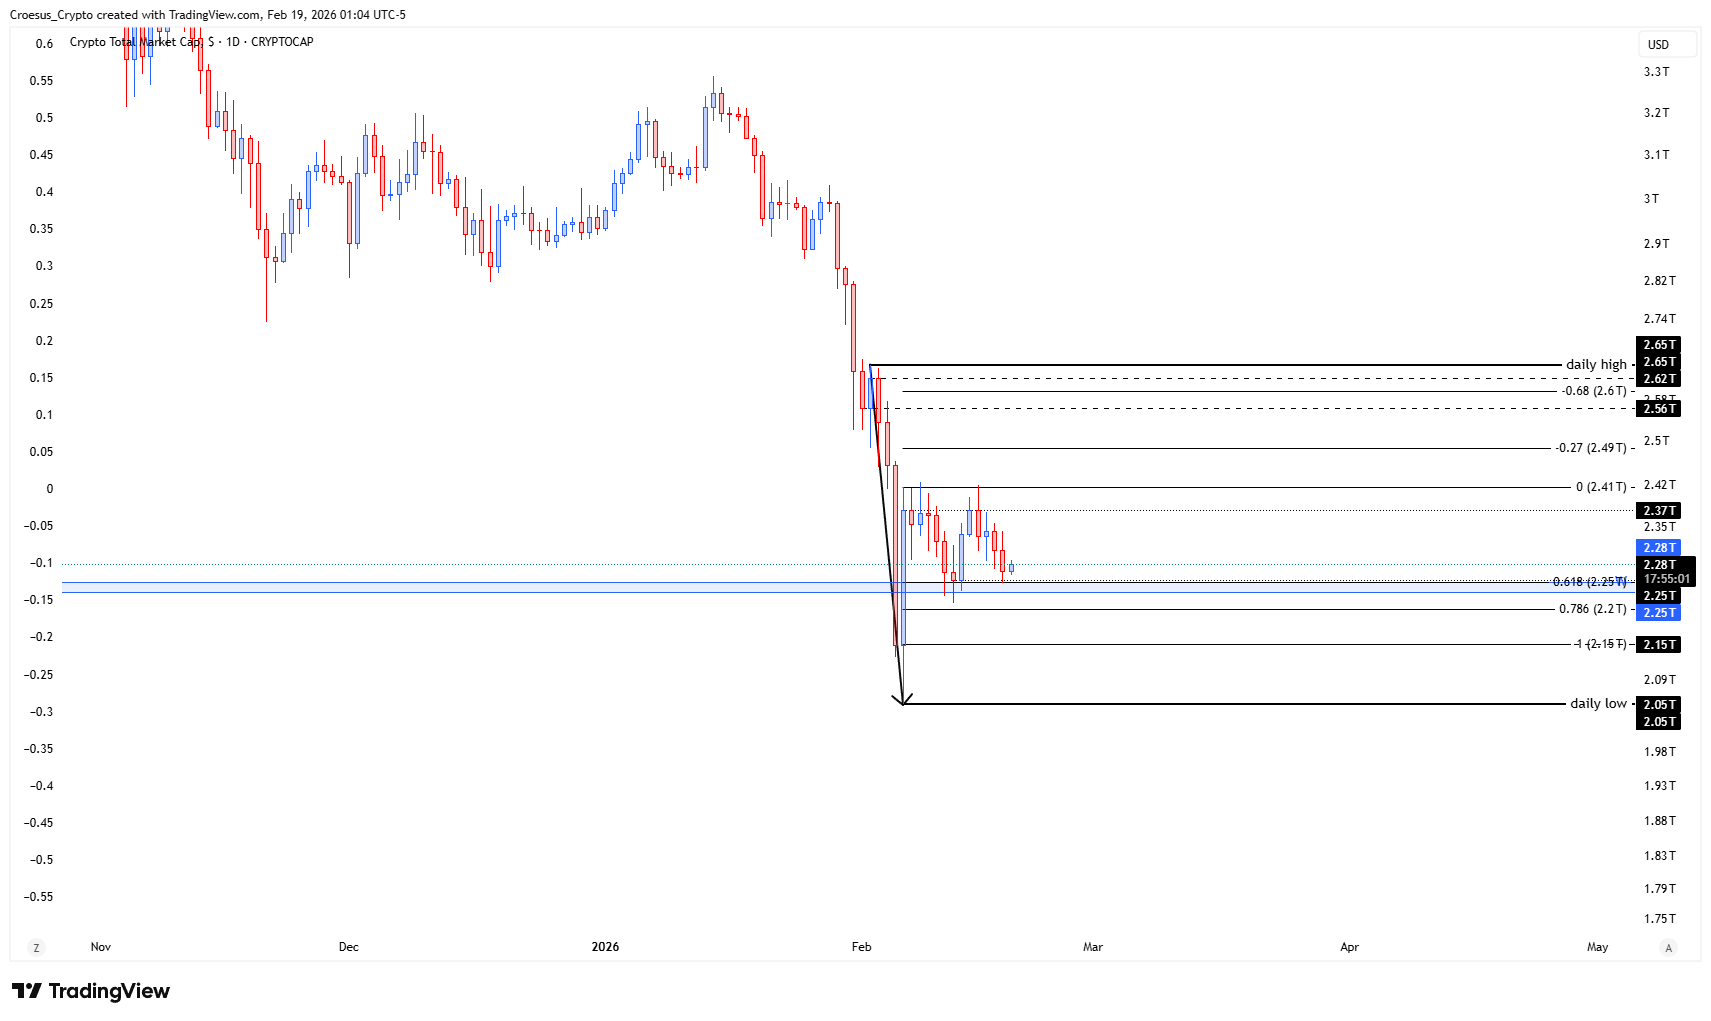
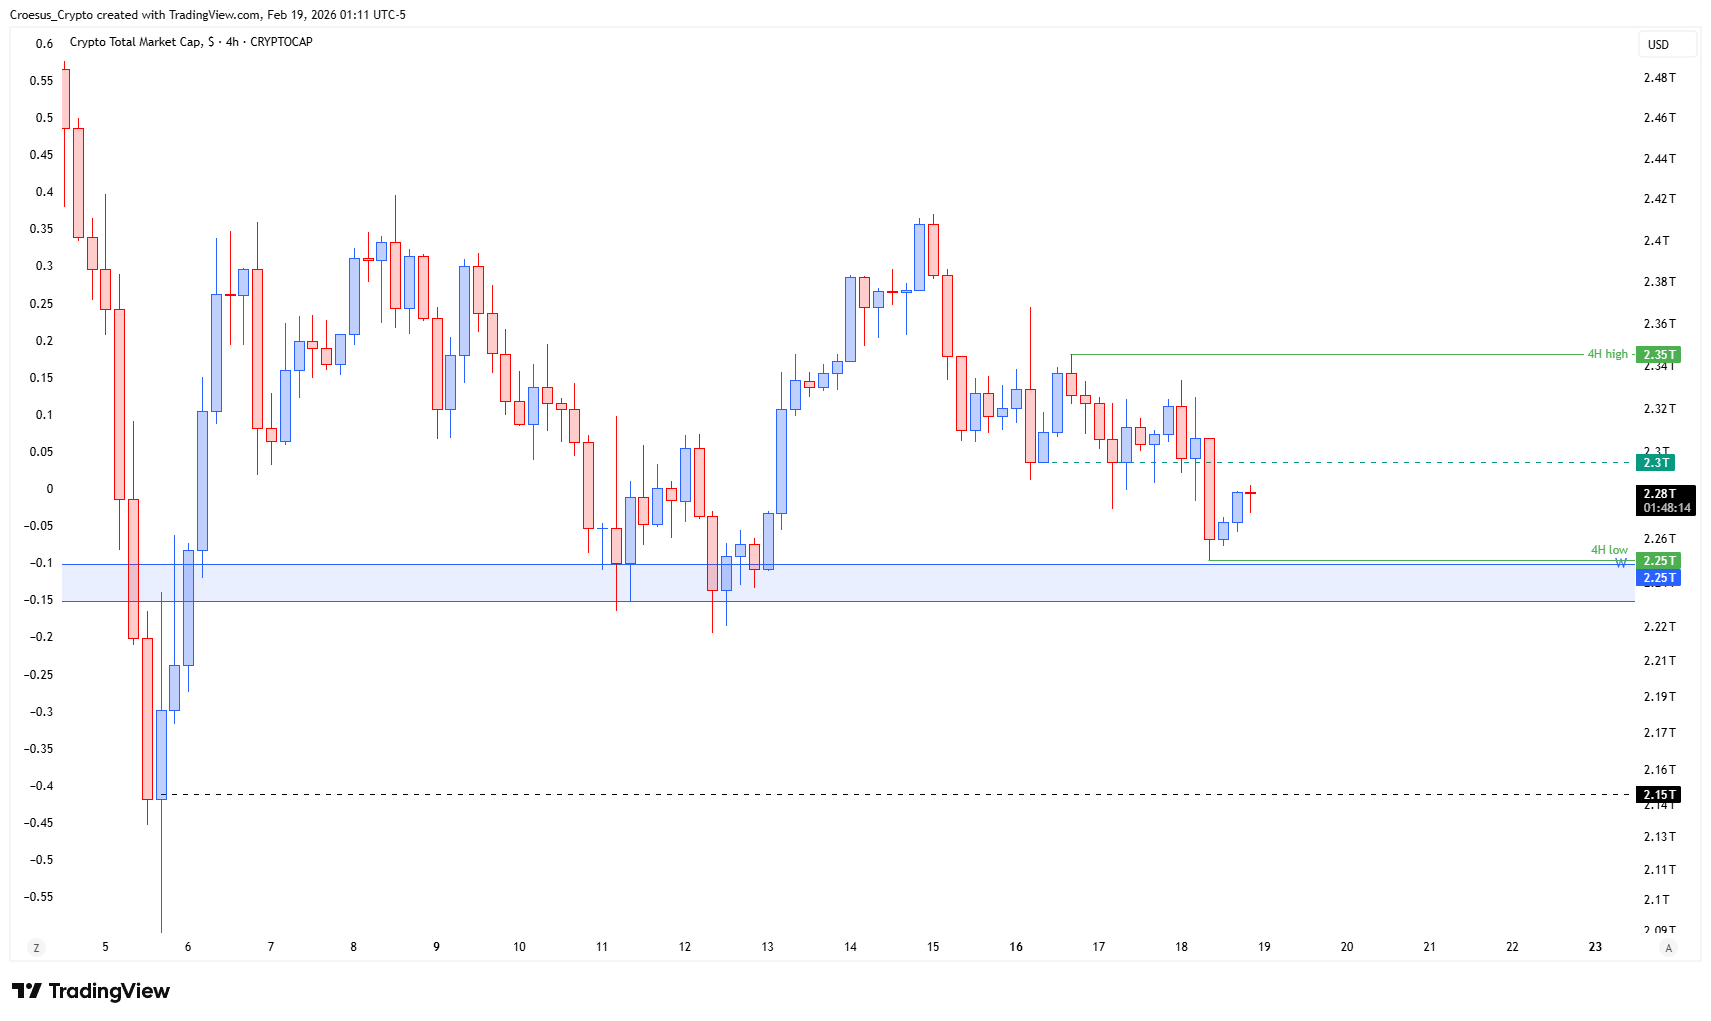
- TOTAL is back at the same level where we saw the last bounce : will this level hold and act as a support for a new bullish move ? Or do we see a sweep of the lows, perhaps even of the daily low ?
Market Structure Analysis
On the daily timeframe, TOTAL sold off aggressively into a low around 2.05T before bouncing and stabilising above the 2.25T demand zone. This area coincides with the lower part of the current range and a key support resistance flip on the higher timeframes.
Price is compressing between that 2.25T base and short-term resistance around 2.37T, with a broader supply band toward 2.56–2.65T, where previous breakdown and Fibonacci retracement levels cluster. As long as candles close above 2.25T, the structure leans toward a corrective pause after the impulsive drop.
A clean sweep below the local equal lows and possibly the daily low at 2.05T would signal continuation of the larger downtrend and open more downside liquidity. Holding the current level and rotating back through 2.37T would instead support a recovery leg.
Key Levels and Scenarios
Buyers defend the 2.25T zone, 4H closes start printing higher lows, and price reclaims 2.37T. That would confirm support, targeting first the 2.56T resistance and then the prior daily high area toward 2.65T.
Critical levels to watch:
- 2.25T: main daily demand / previous bounce zone; must hold for bullish continuation.
- 2.15T: intermediate liquidity pocket inside the wick zone.
- 2.05T: daily low and major downside liquidity; loss would confirm further trend weakness
- 2.37T: range mid / first resistance; reclaim turns structure more constructive.
- 2.56–2.65T: higher-timeframe resistance and Fibonacci confluence; major upside target in a bullish scenario.
Trading Implications
For active traders, the 2.25T band is the key decision area: conservative participants wait for either a confirmed bounce above 2.37T to join strength, or a clean sweep below 2.25T/2.05T followed by strong reclaim before fading the breakdown; position sizing should reflect elevated volatility around these liquidity levels.
This analysis is for informational purposes only and does not constitute financial advice.