TOTAL Marketcap / Crypto Total Market Cap
TOTAL daily analysis 18/03/2026. TOTAL is trading in a bearish context after tagging a key level and delivering the expected relief rally, with price now rotating back down into a Fibonacci-based decision zone.
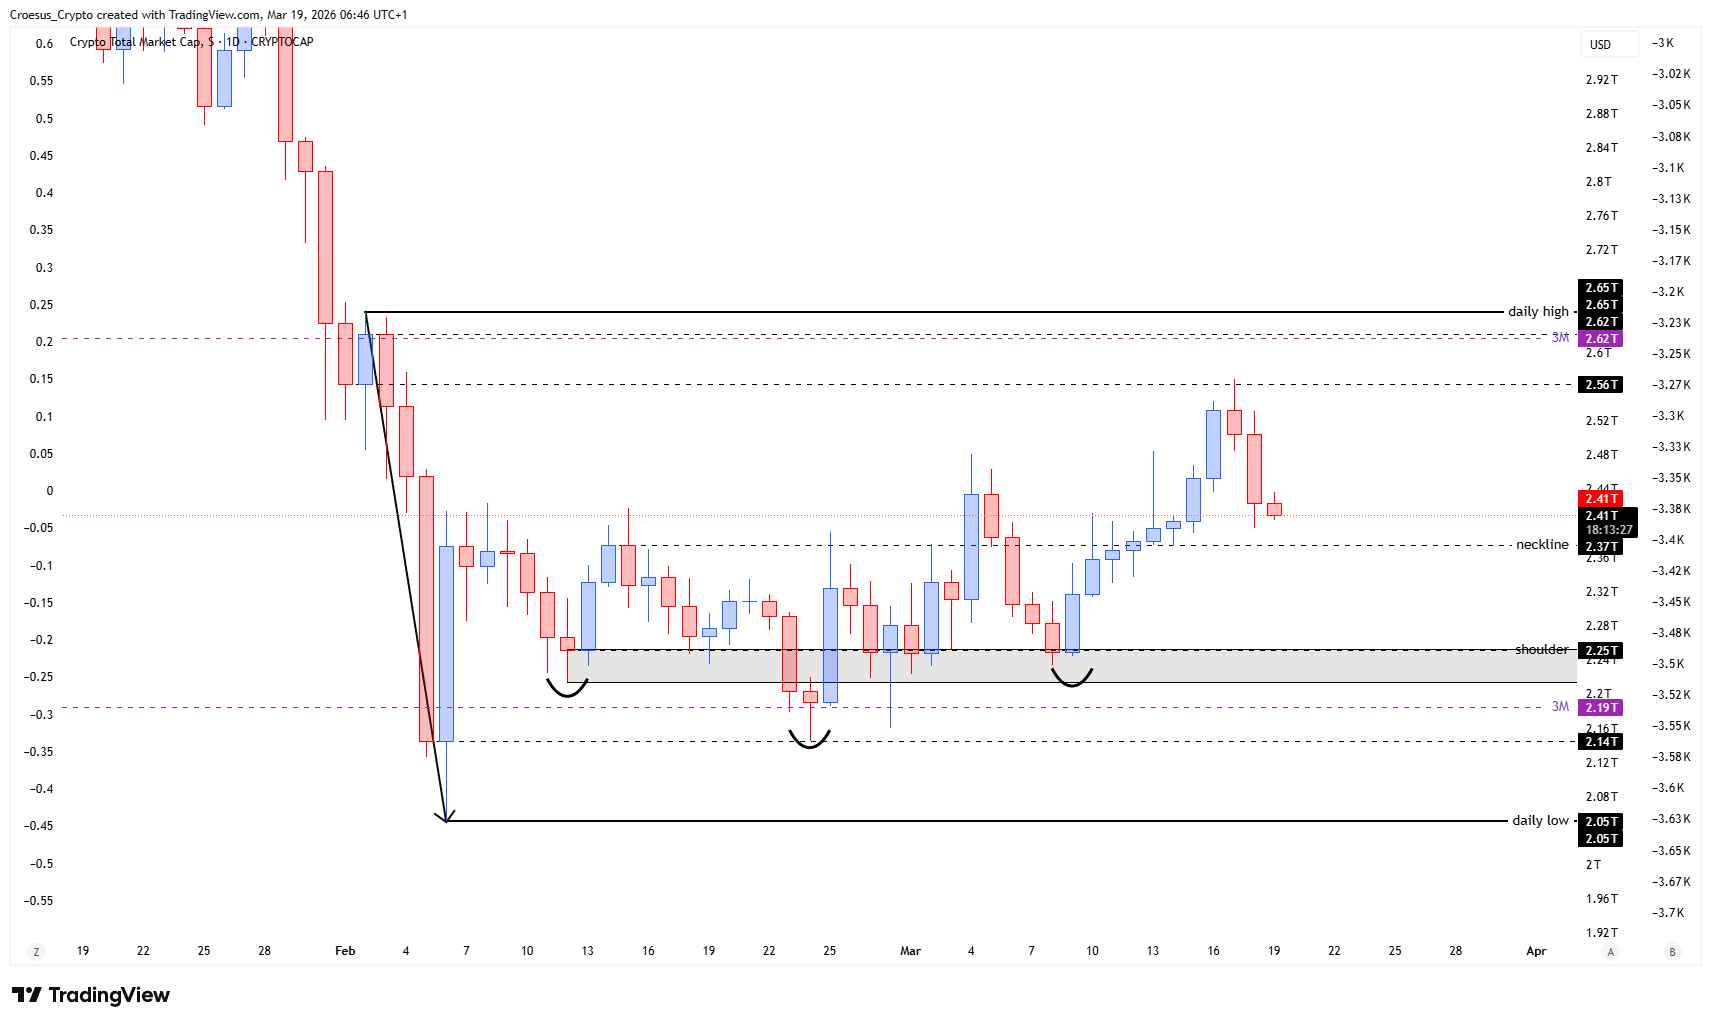
- After hitting a key level the relief rallye was expected and was confirmed with the bearish move down; approaching the golden pocket (between fib level 0.618 and 0.786.
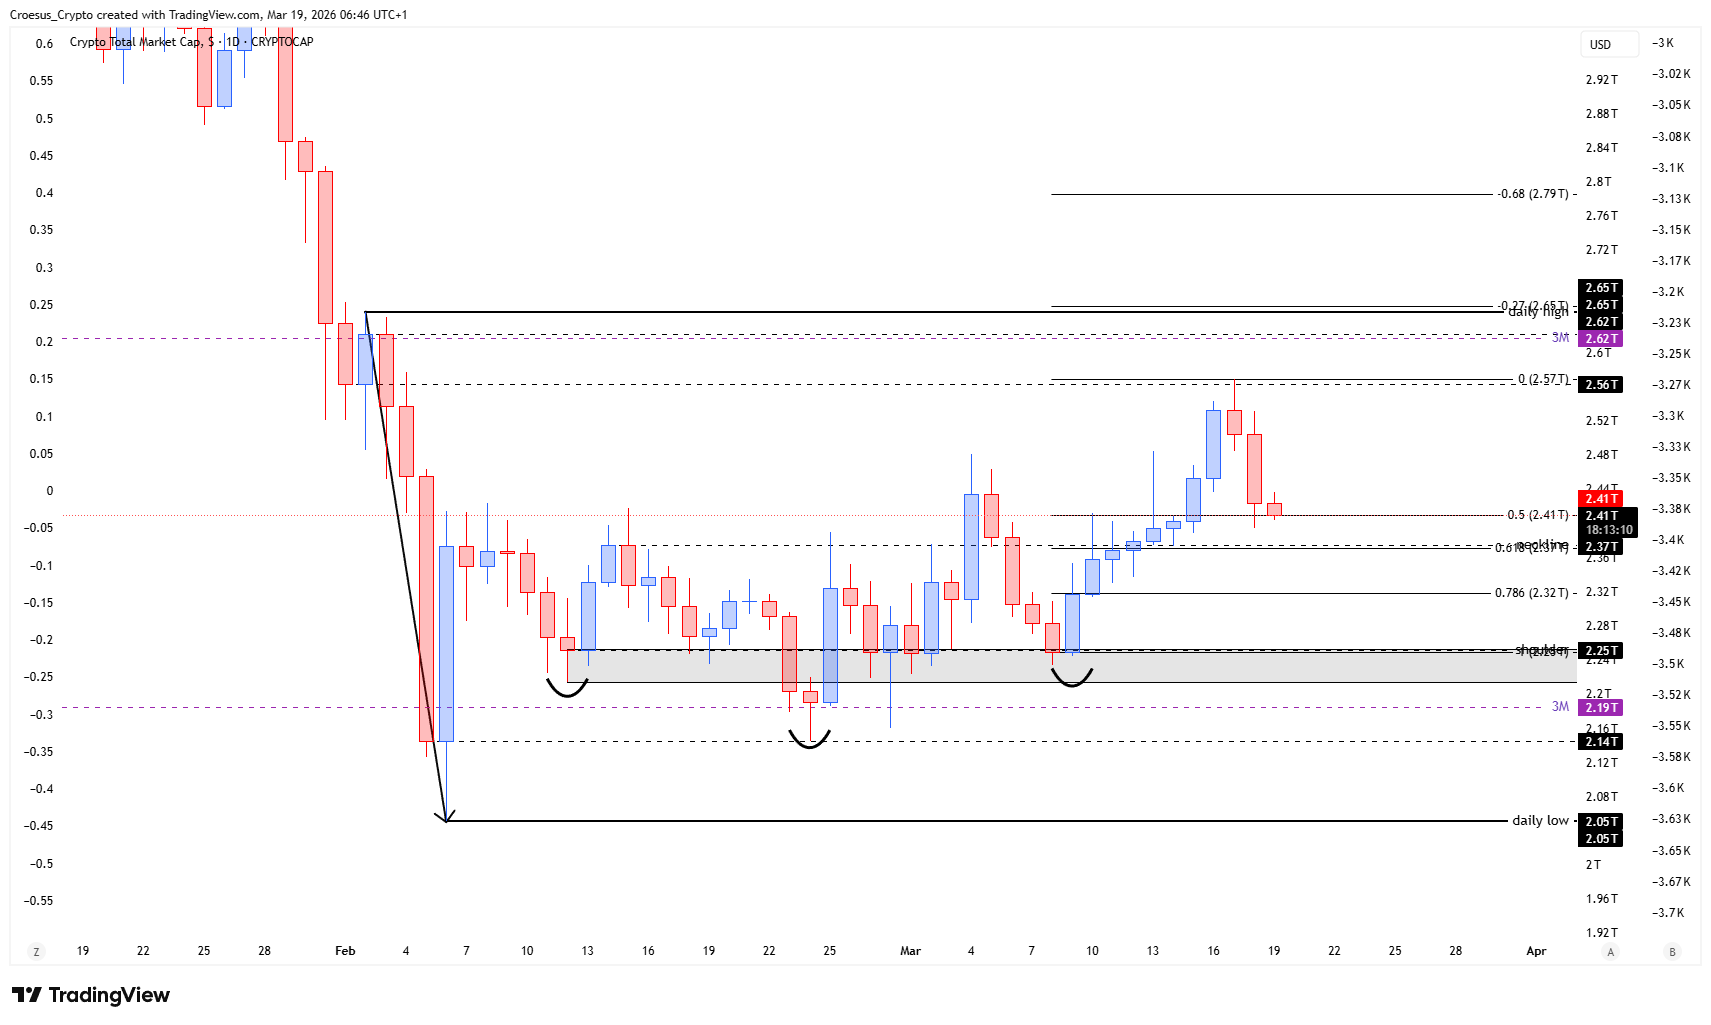
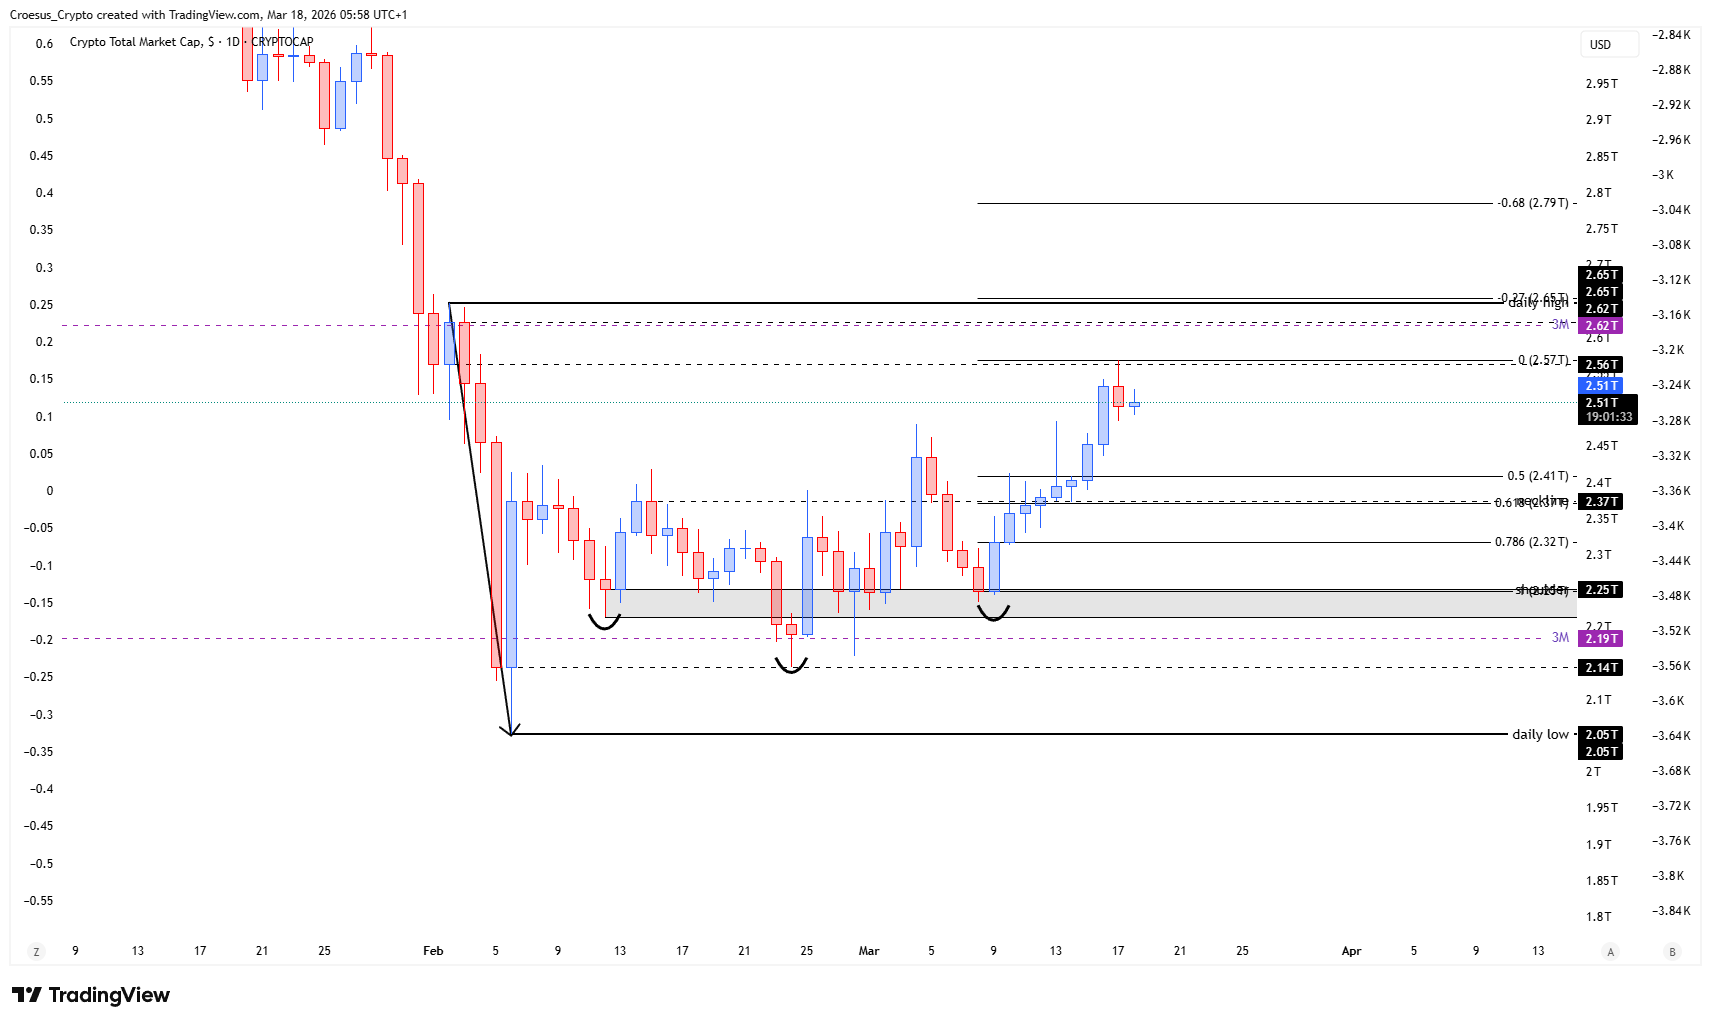
- If we take the Fibonacci retracement from this move up, we can see that the 0.618 level aligns perfectly with the neckline, and the -0.27 aligns perfectly with the daily high.
Market Structure Analysis
From a market structure perspective, TOTAL showed a corrective relief rally into a key level, then confirmed bearish intent with a rotation back down. Our technical analysis focuses on clean support resistance and Fibonacci confluence: price is now approaching the golden pocket ($0.618–$0.786 retracement zone), which often acts as a high-interest area in a downtrend. The analysis also highlights a critical confluence where the $0.618 retracement aligns with the neckline, strengthening that horizontal level as a structural pivot. On the upside, the -$0.27 Fibonacci alignment with the daily high defines the most recent swing cap and a clear reference point for any corrective retrace before continuation.
Key Levels and Scenarios
In this TOTAL daily analysis, bearish continuation is favoured if price rejects from the golden pocket and respects the neckline as resistance. A stronger counter-trend response would require reclaiming the neckline cleanly and pushing back above the daily high confluence area, signalling that the corrective leg is extending rather than resuming the bearish move.
- Golden pocket ($0.618–$0.786) as the active decision zone for the current pullback
- $0.618 retracement confluence with the neckline as primary support resistance pivot
- -$0.27 Fibonacci alignment with the daily high as the local bearish invalidation reference
Trading Implications
Risk is concentrated around the golden pocket and neckline confluence: aggressive participants typically react to rejection/acceptance here, while conservative traders often wait for a clear break of structure away from this zone. The cleaner the reaction around these horizontal levels, the higher the quality of the next directional move.
This analysis is for informational purposes only and does not constitute financial advice.