


TOTAL Marketcap / Crypto Total Market Cap
In this TOTAL daily analysis for 19 February 2026, we see the crypto total market cap stabilising after a sharp impulsive drop. Price is compressing above the recent daily low while interacting with previous support resistance and nearby Fibonacci retracement levels, keeping a corrective structure in focus.
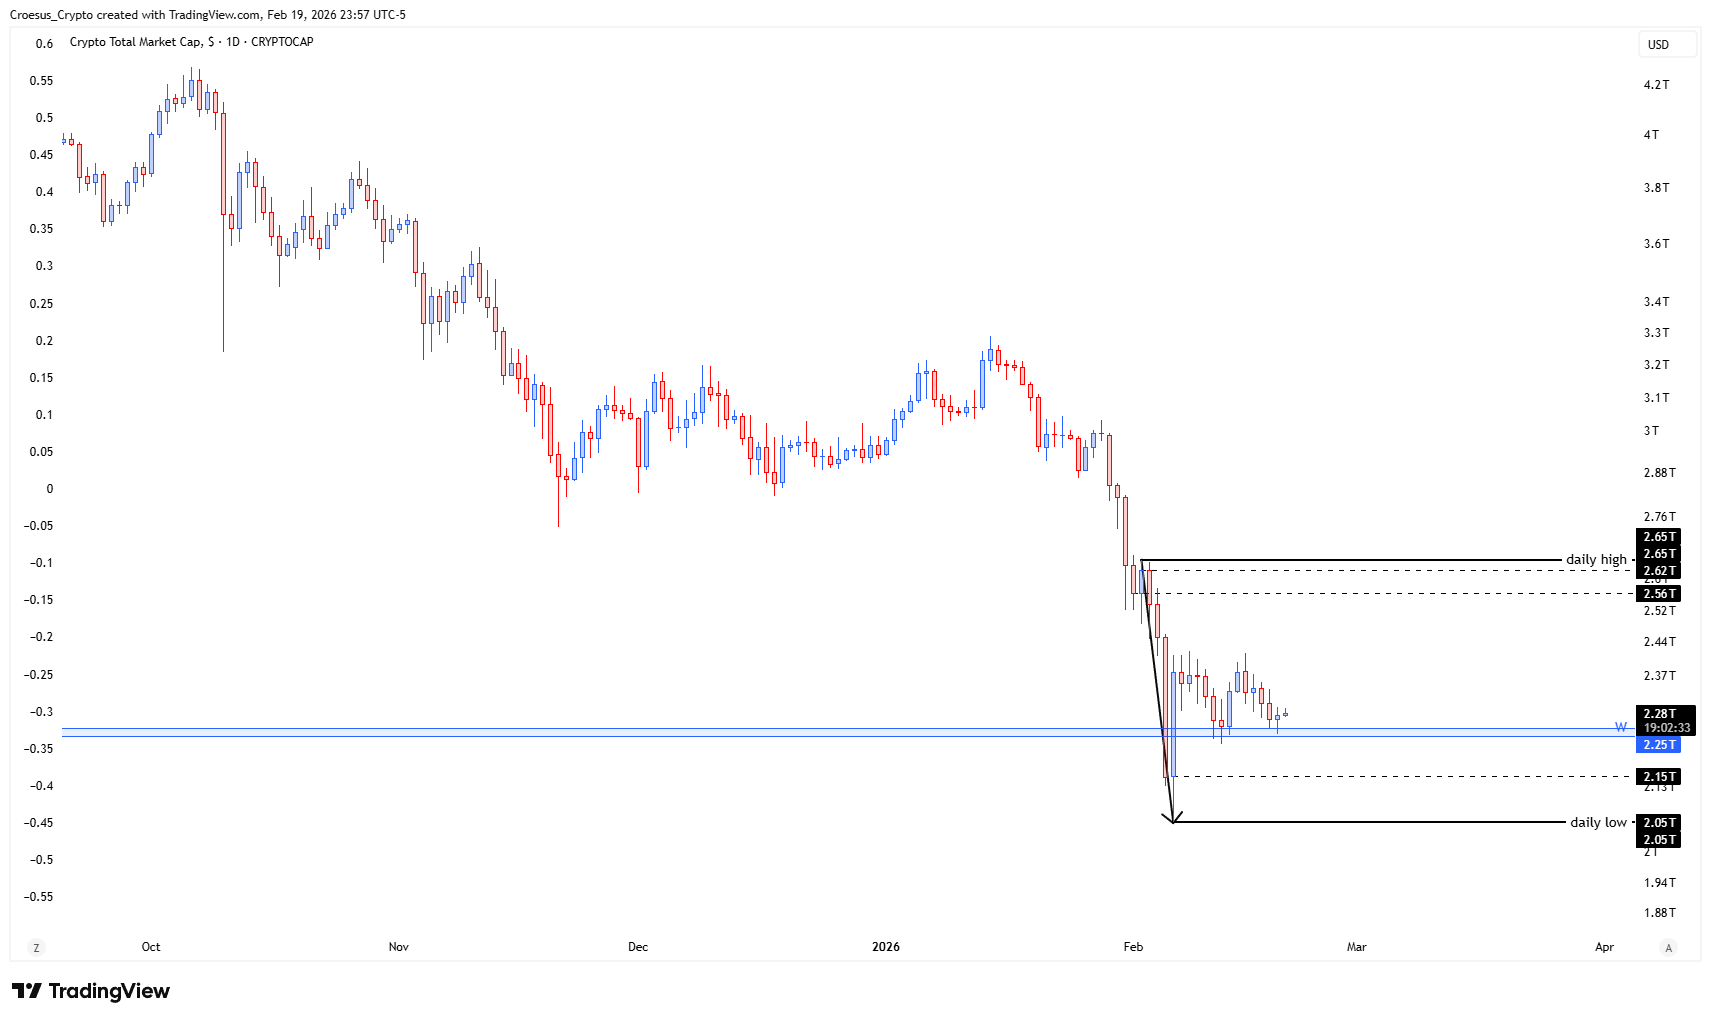
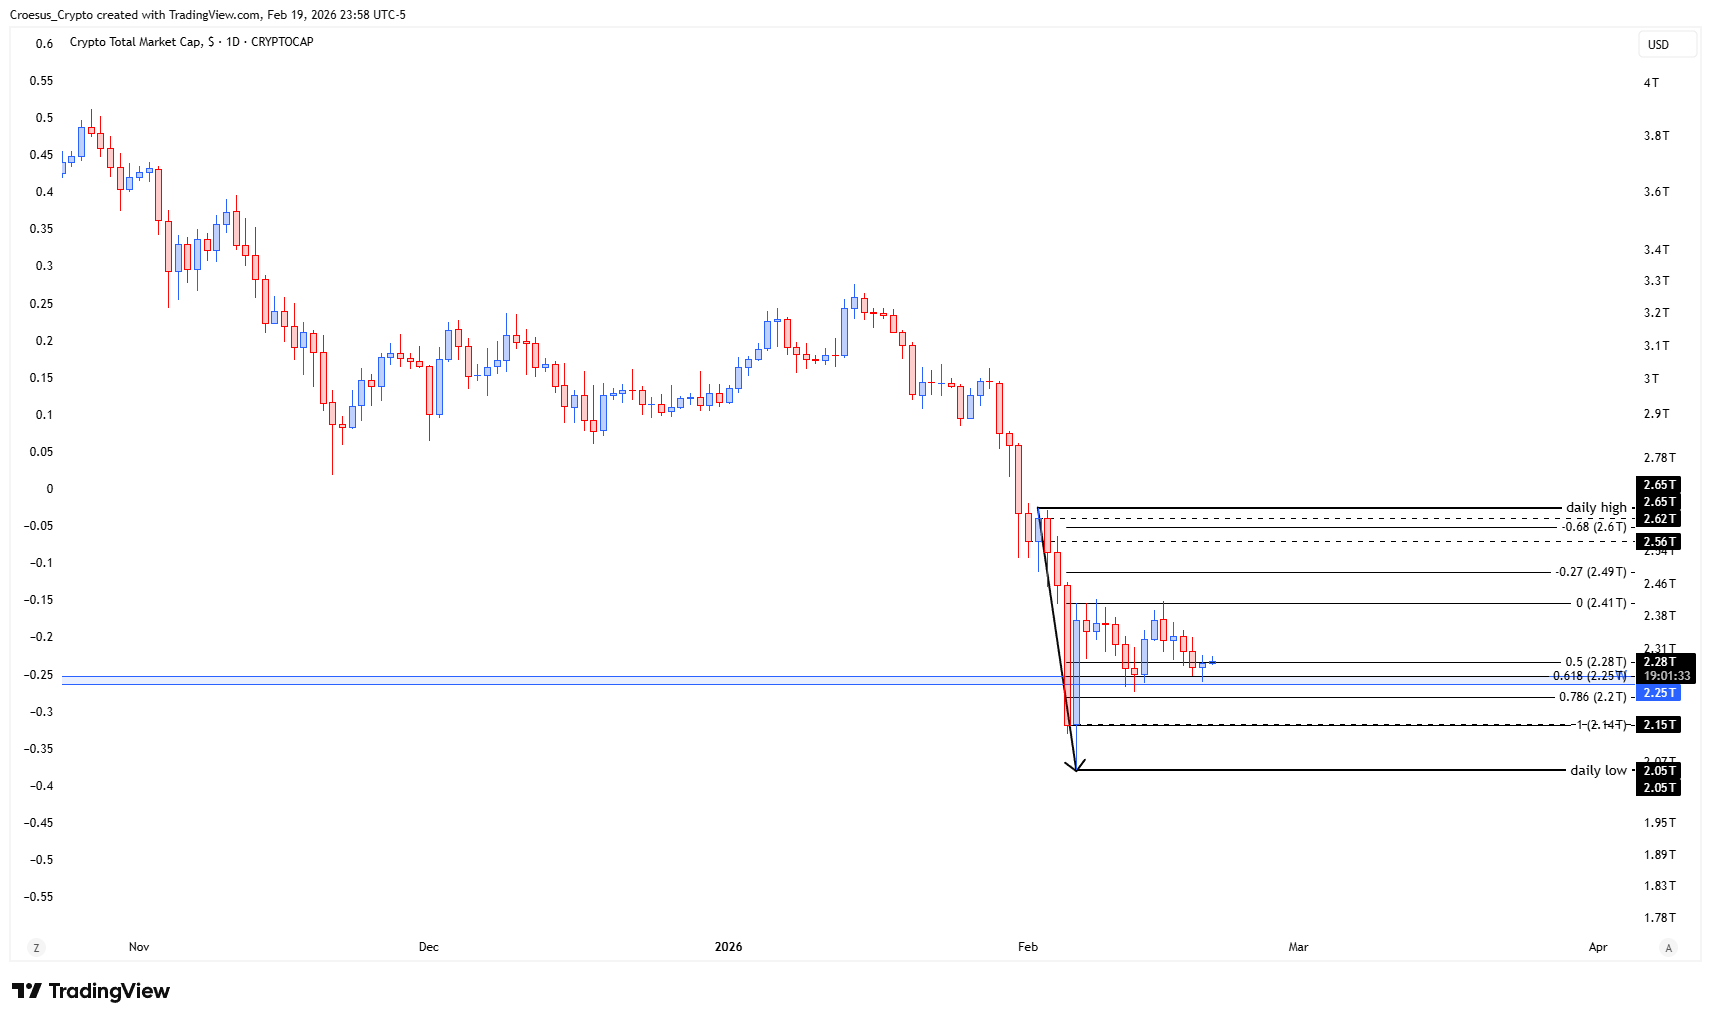
- TOTAL is slowing down on this level. Question is : will it hold this level and act as support ? Or will we retest the daily low ?
- a possible ABC correction remains in play
Market Structure Analysis
Our technical analysis highlights a clear impulsive move down followed by sideways-to-slightly-up price action, typical for an "ABC" style correction. The current base sits just above the marked daily low, turning this zone into a decision point for the next leg. As long as this level holds, we treat it as provisional support, with the corrective cluster of Fibonacci levels above acting as the first resistance band. A clean break below the daily low would invalidate the ongoing corrective idea and reopen room for another impulsive extension lower.
Key Levels and Scenarios
Bullish scenario:
If buyers defend the current support and push price through the local corrective highs, the ABC correction can complete with a move back toward the previous daily high region, reclaiming a meaningful portion of the last selloff.
Critical levels to watch:
- 2.25T: main daily demand / previous bounce zone; must hold for bullish continuation.
- 2.15T: intermediate liquidity pocket inside the wick zone.
- 2.05T: daily low and major downside liquidity; loss would confirm further trend weakness
- 2.37T: range mid / first resistance; reclaim turns structure more constructive.
- 2.56–2.65T: higher-timeframe resistance and Fibonacci confluence; major upside target in a bullish scenario.
Trading Implications
From a risk/reward standpoint, aggressive participants may only consider exposure near support with tight invalidation below the daily low, while conservative traders wait for a confirmed break above local resistance before positioning.
This analysis is for informational purposes only and does not constitute financial advice.