


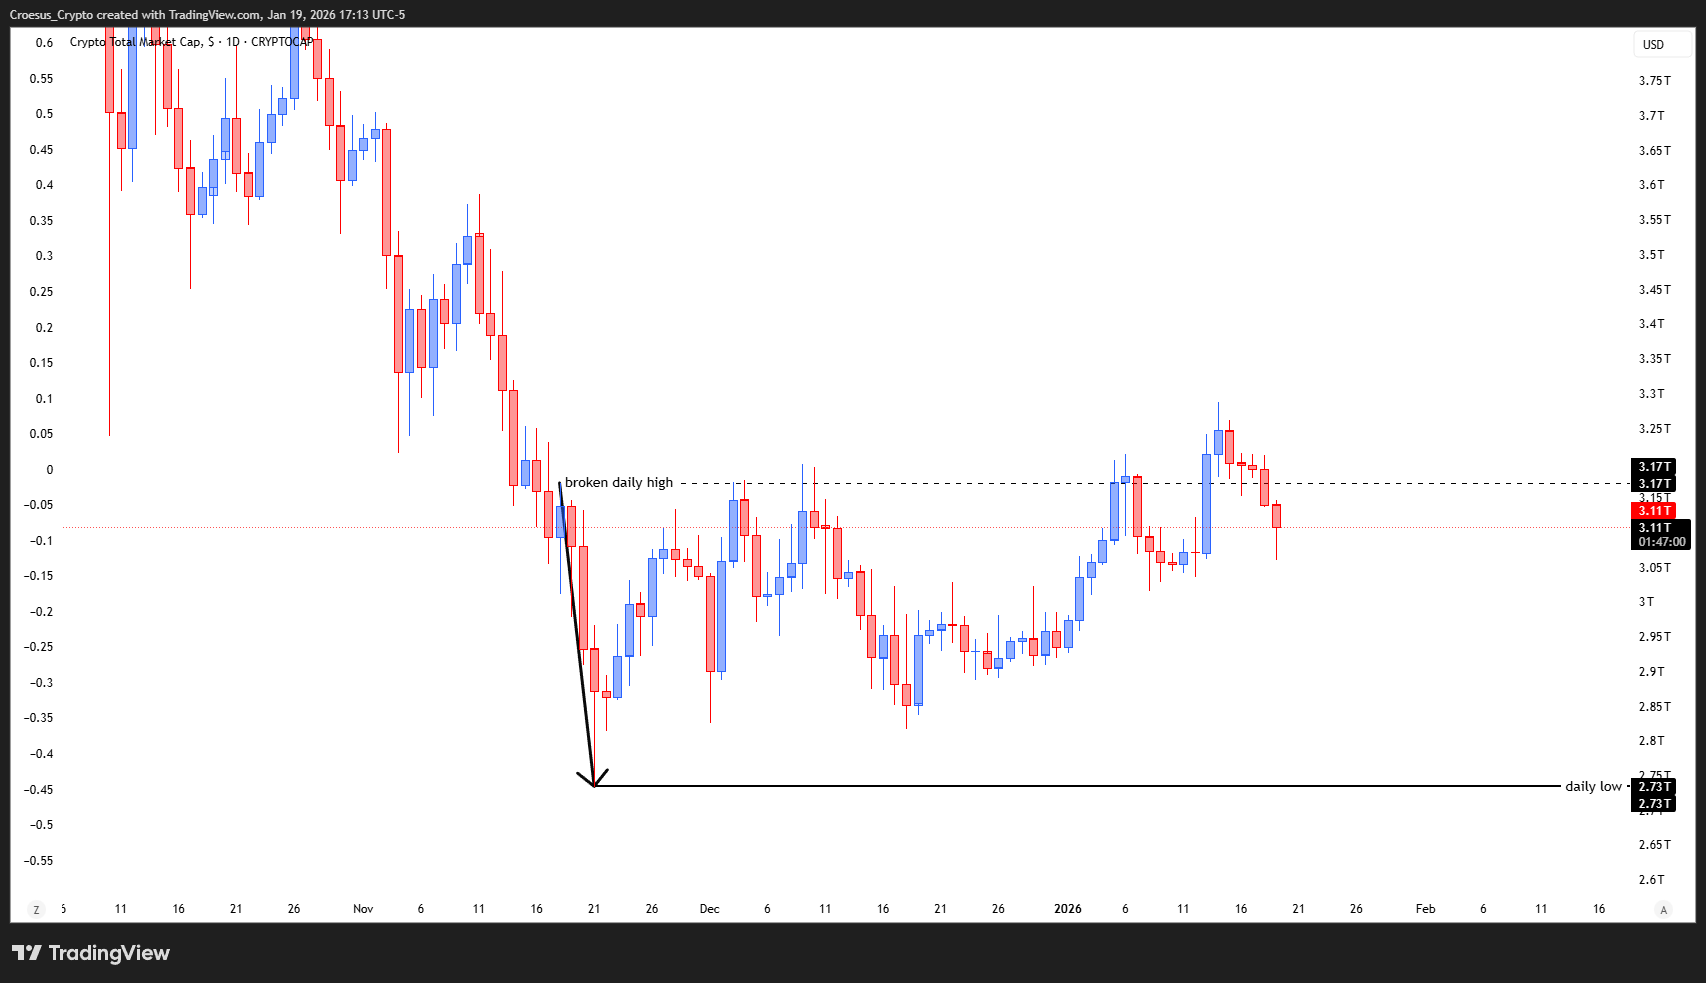
In this TOTAL daily analysis for January 2026 we see the market entering a key decision zone after a sharp corrective move that started on Thursday and extended into the weekly close. Our analysis focuses on the interaction with the broken daily high around 3.17T and the 3.05T support area, where both bullish and bearish structures are visible.
TOTAL daily analysis chart 19 Jan 2026 with prior daily range, broken daily high, and 3.05T–2.73T support zone.
Technical analysis
- On Thursday started the corrective bearish move.
- On Friday and Saturday the index gave us the impression to be respecting the broken daily high as support.
- But, as also mentioned in the weekly analysis, during the last hour of the weekly candle, on Sunday, there was quite an impulsive bearish sell off. With this move the index has fallen back again in the prior daily range. Does this mean anything ? At this moment not.
- We can notice two possible set-ups.
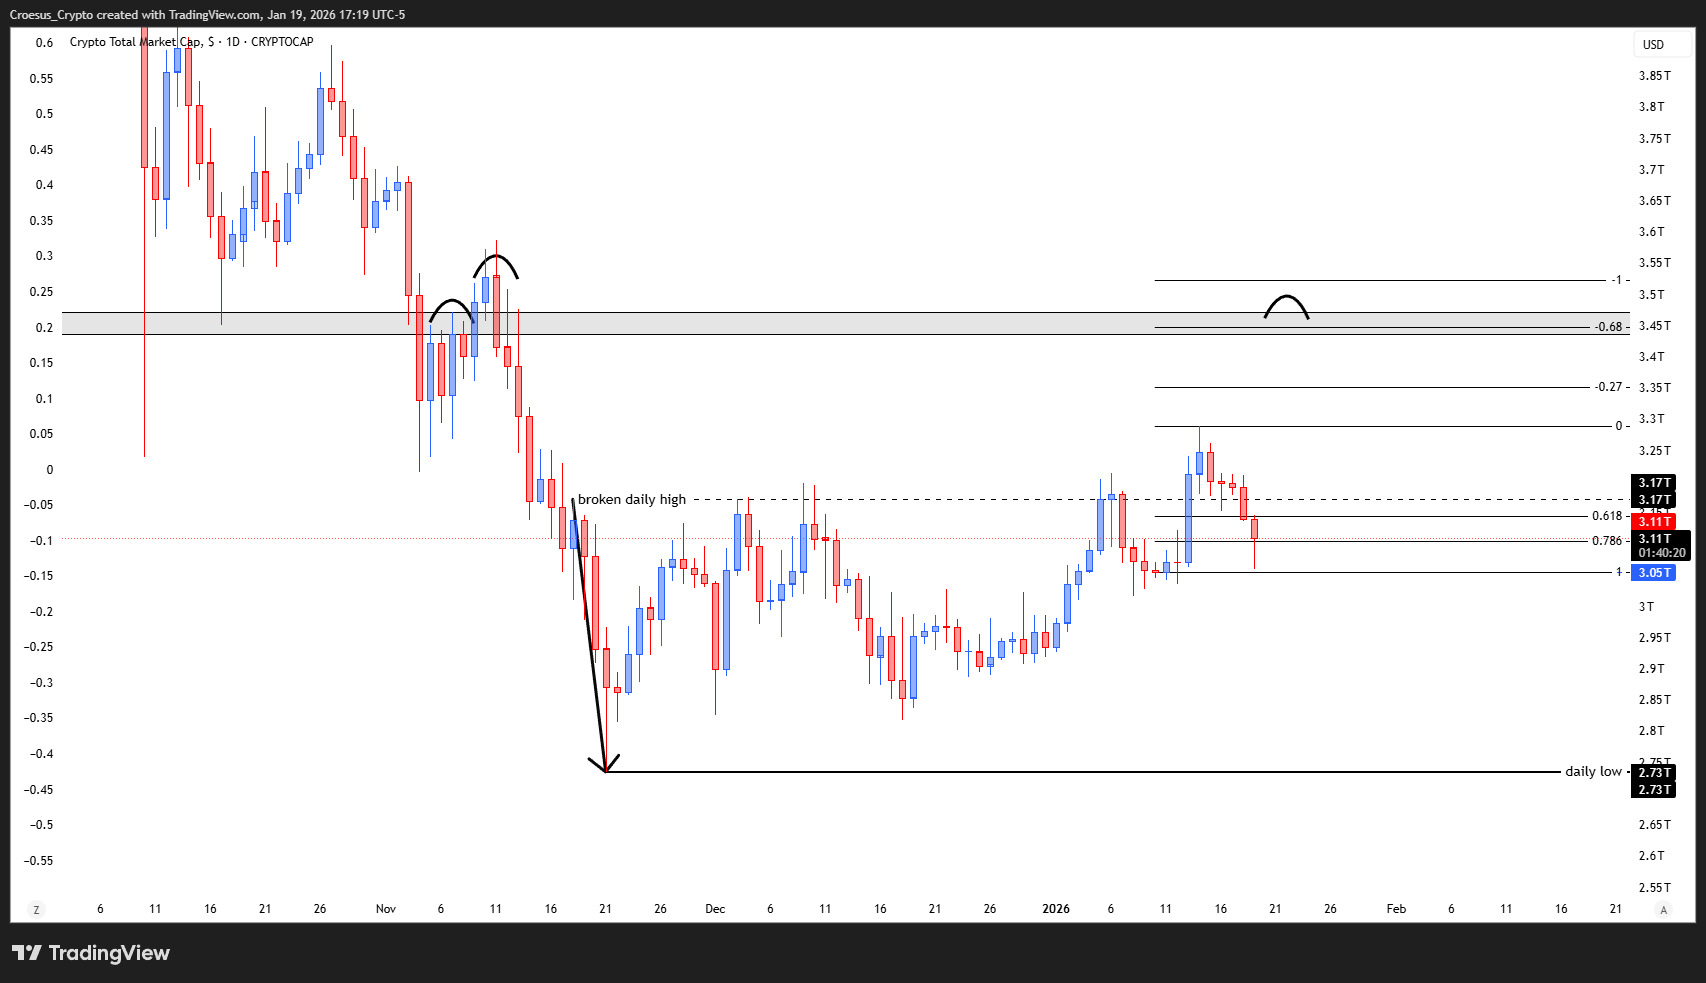
- bullish : we have broken the prior daily high, this means we are bullish. If we look at the actual pattern, we can clearly see a bullish M. We see a 100% fib retracement followed by a long wick. If we take the fib retracement, we can see the -0.68 aligning with the shoulderlevel of a larger head & shoulder level.
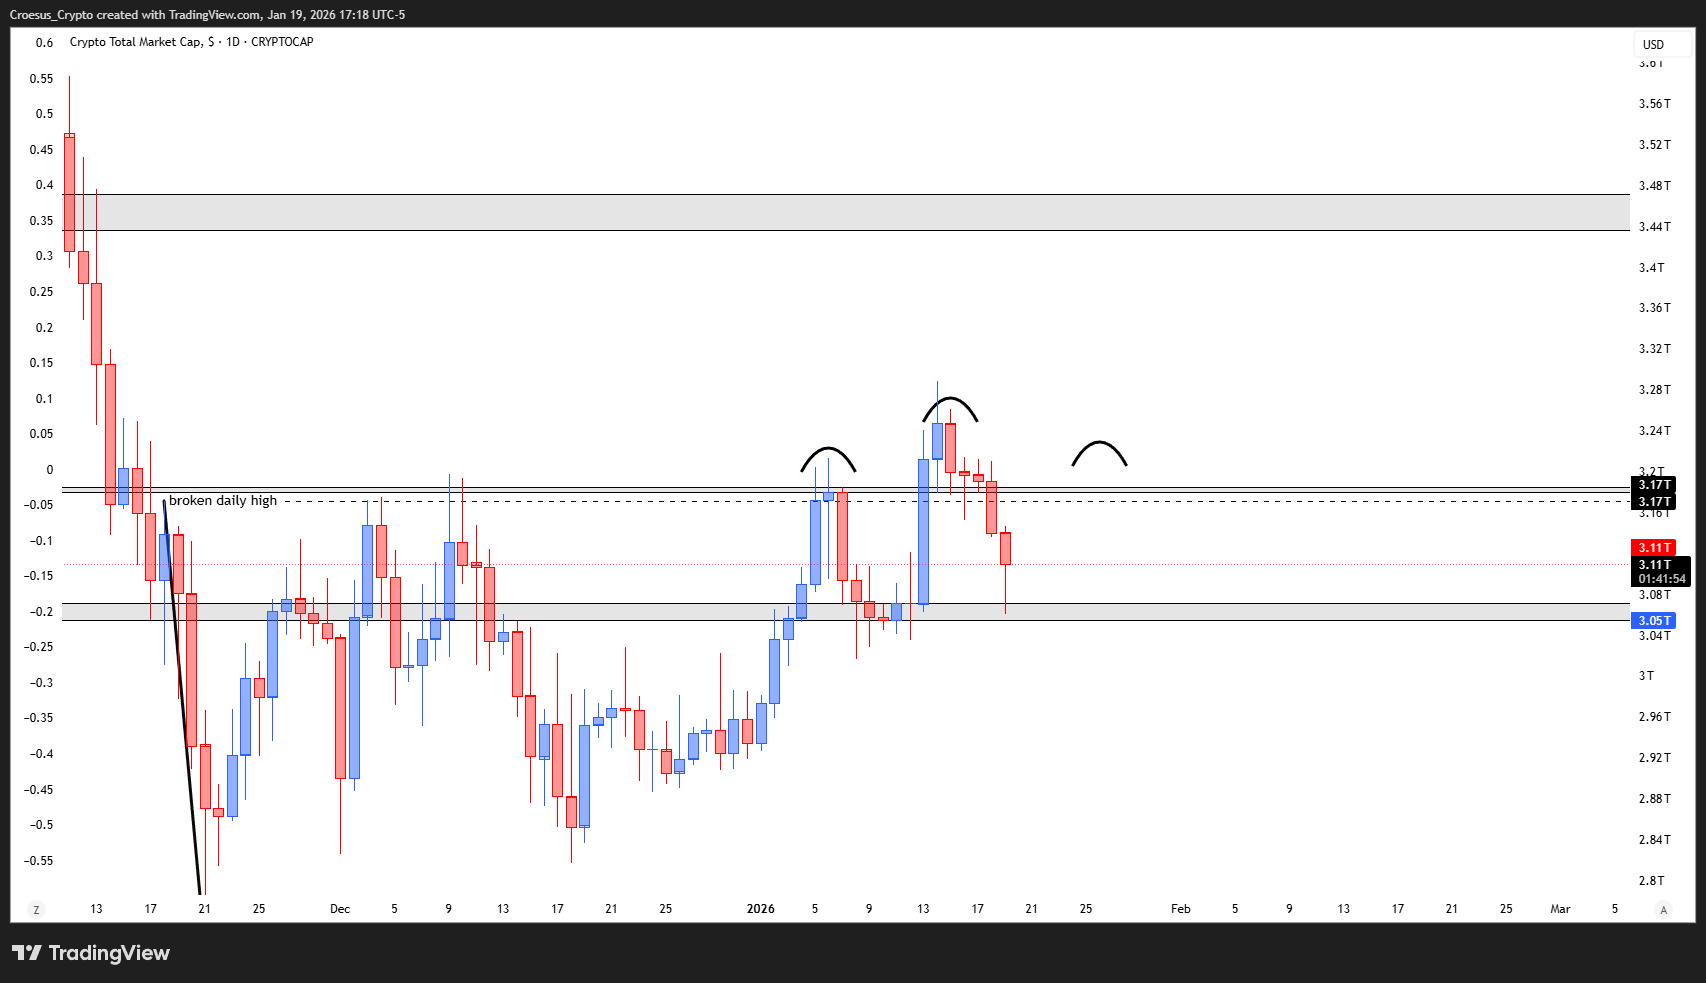
- bearish : the index did not respect the prior daily high as support and has fallen back into the prior daily range. What if the recent high is the head of a developing head and shoulder ? And the broken prior daily high acts more or less as the shoulderlevel ? In that case the retest of the 3.17T has to be followed critically. Rejecting at that level confirms the H&S set-up, strictly a double top is also still possible.
- Taking a long at this point should be taken with caution. Put your trade at least at breakeven before testing the 3.17T level.
Market Structure Analysis
From a market-structure perspective, this TOTAL daily analysis highlights a corrective leg that pushed price back inside the prior daily range after temporarily treating the broken daily high as support. The impulsive Sunday sell-off suggests that the breakout above that high is not yet fully accepted by the market.
On the bullish side, the current “bullish M” structure is built on a 100% Fibonacci retracement into the 3.05T support area, with a strong rejection wick. This keeps a higher-timeframe bullish technical analysis intact as long as 3.05T holds. A clean reclaim and hold above 3.17T would reopen the path towards the larger resistance cluster and the -0.68 Fibonacci extension, which aligns with a potential larger shoulder level.
Bearish structure remains possible: the most recent high could still evolve into the head of a developing head & shoulders pattern, with 3.17T acting as the neckline/shoulder level. Failure to reclaim and acceptance below 3.05T would increase the probability of a deeper move towards the 2.73T daily low.
Key Levels and Scenarios
Bullish scenario:
Hold 3.05T as support and form higher lows.
Reclaim 3.17T and flip it back to support.
Upside targets: 3.30T–3.45T, then the -0.68 Fibonacci extension zone if momentum accelerates.
Key levels to watch
3.17T – Prior daily high / key resistance, potential H&S shoulder.
3.10T–3.11T – Short-term mid-range, intraday decision area.
3.05T – Current support and base of bullish M.
2.90T – Intermediate support if 3.05T fails.
2.73T – Major daily low and last strong support of this range.
Trading Implications
For active traders, long exposure here demands strict risk management: consider keeping size moderate, protecting entries to breakeven before a retest of 3.17T, and only adding risk on confirmed acceptance above that resistance; aggressive shorts may look for rejection wicks at 3.17T, but must be managed tightly given the underlying bullish context.
This is not financial advice; always do your own research and manage risk accordingly. The structure of this analysis follows our internal trade plan framework