TOTAL Marketcap / Crypto Total Market Cap
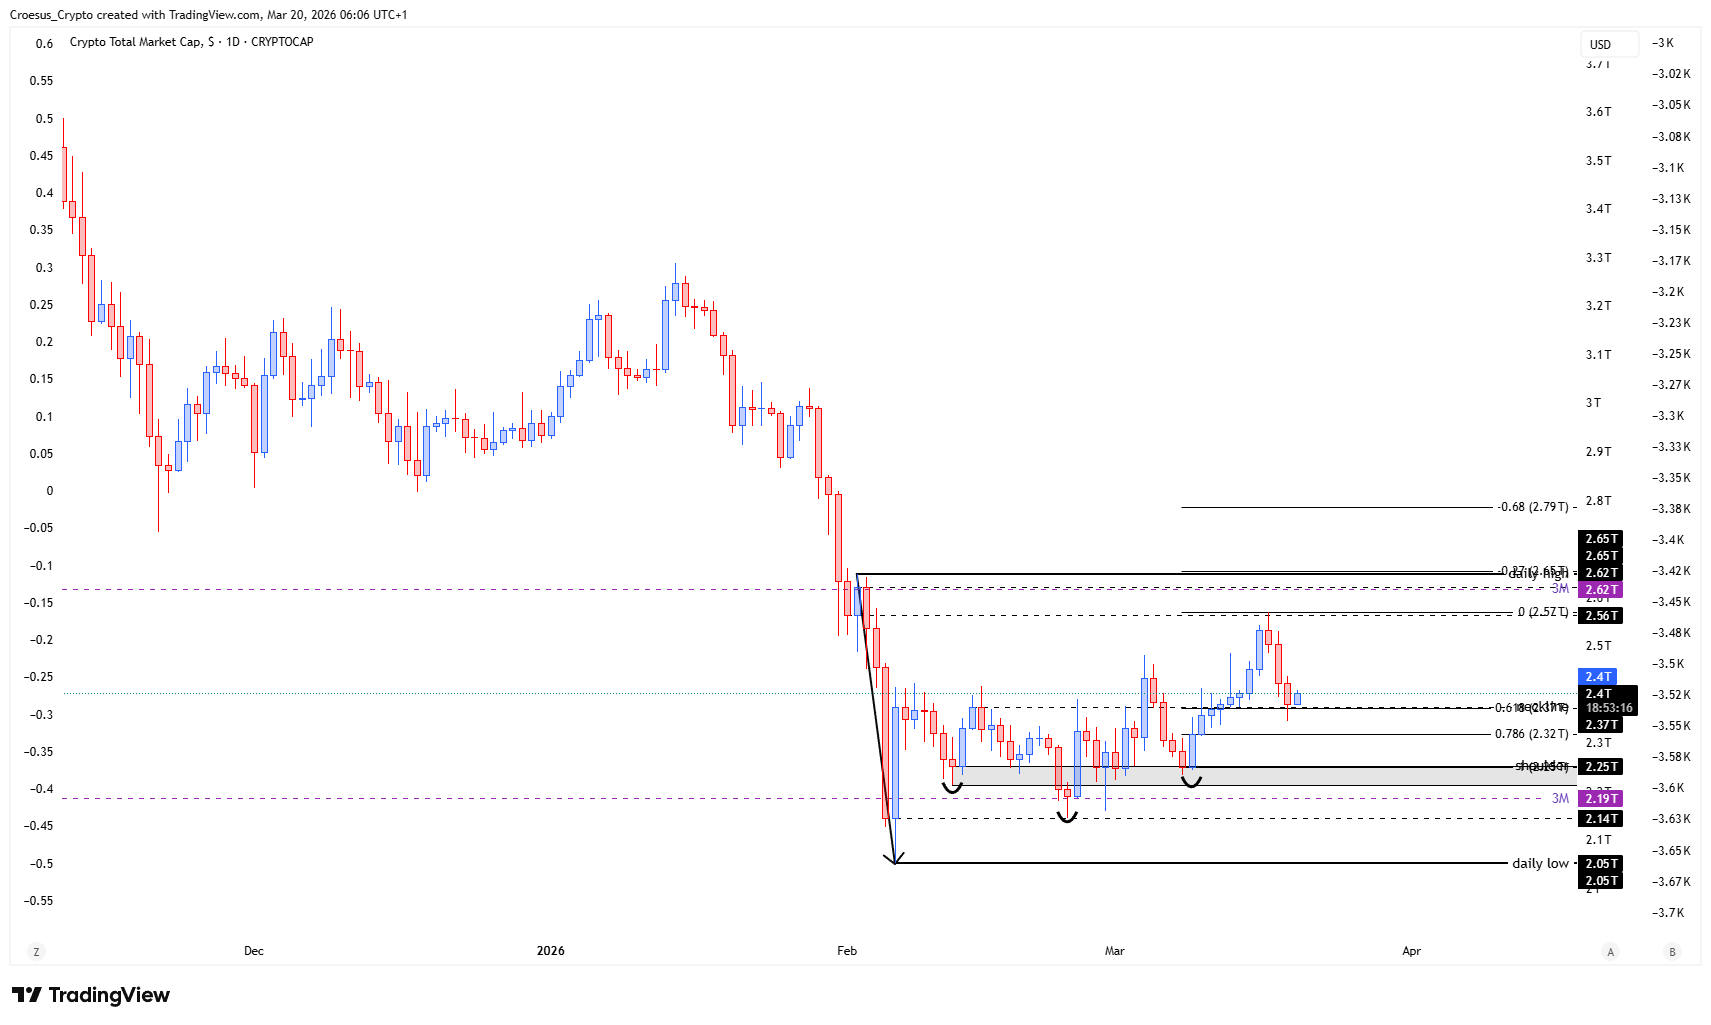
TOTAL daily analysis 19/03/2026. Our technical analysis shows TOTAL remains in a bearish structure, with the latest relief move stalling into a key confluence zone where support resistance and Fibonacci overlap.
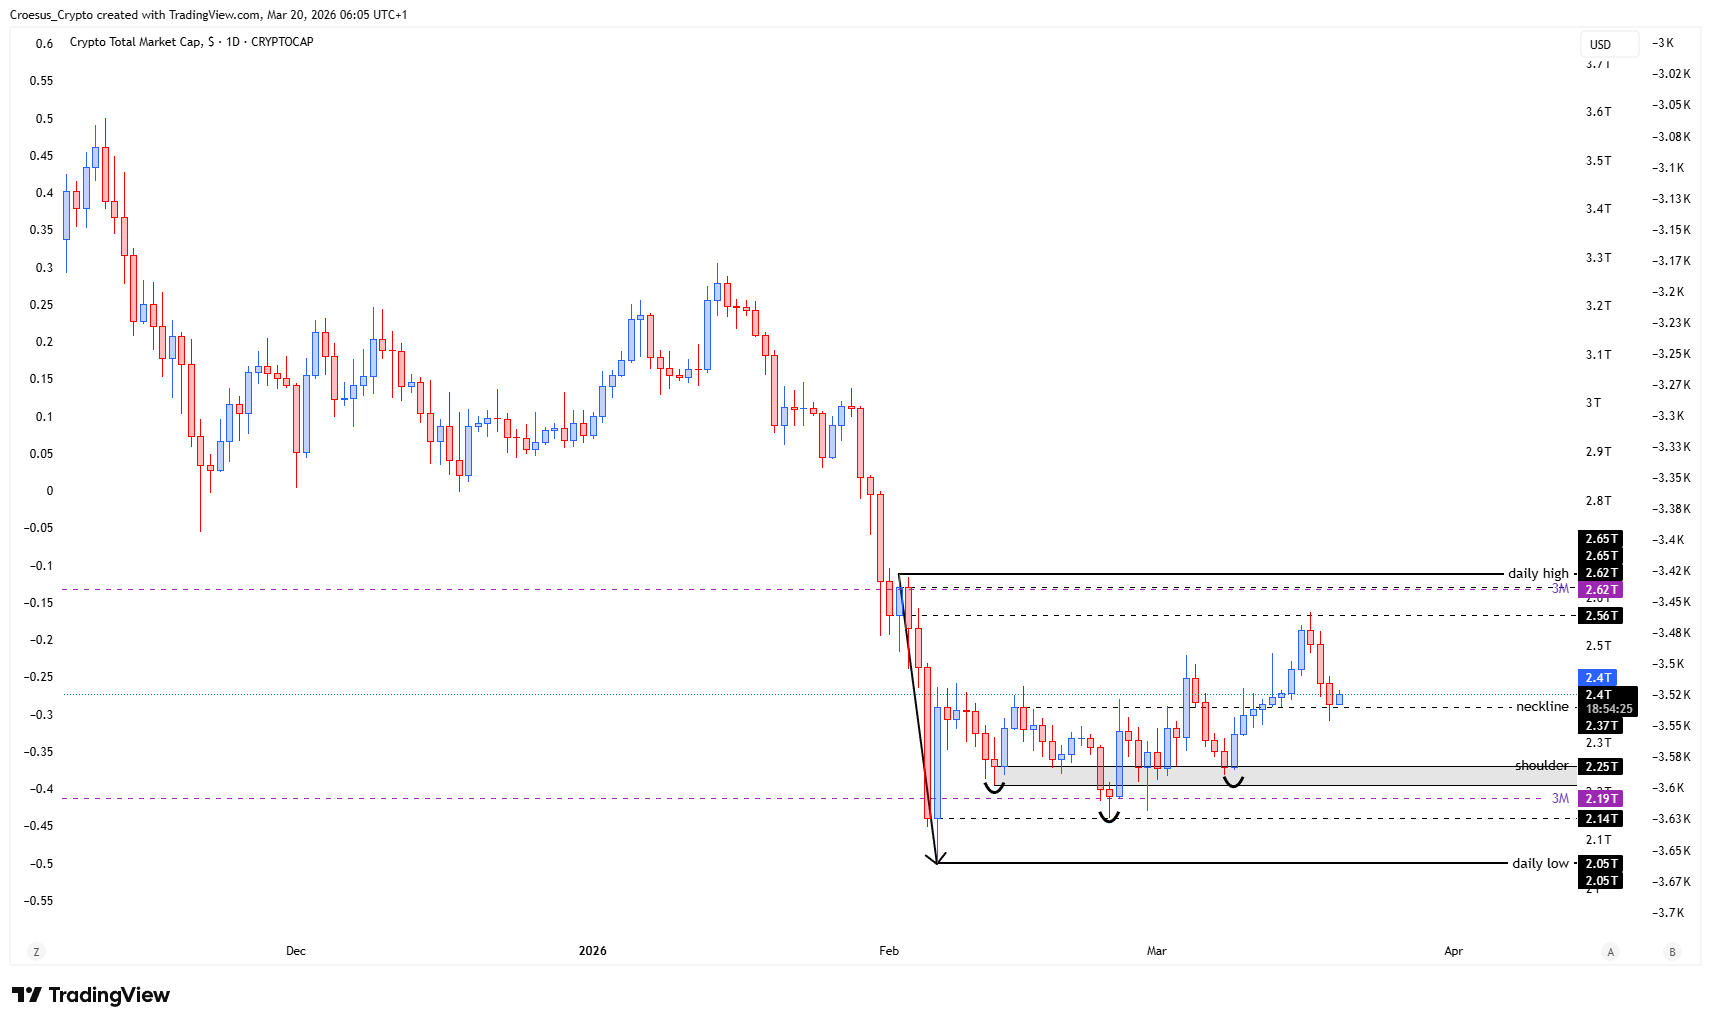
- The relief hit the neckline, which aligns perfectly with the 0.618 fib retracement level.
- If this level holds as support, the -0.27 aligns perfectly with the daily high and this could be our next target.
Market Structure Analysis
From a naked-trading perspective, the current TOTAL daily analysis is defined by a bearish environment that is allowing a relief rally to retrace into prior structure. The neckline acts as a clean horizontal reference point: when price rallies back into a neckline during a broader bearish leg, it often behaves as a decision zone where the market either confirms the downtrend (rejection and continuation) or shifts into a deeper corrective structure (acceptance and consolidation above). The added confluence with the 0.618 Fibonacci retracement level strengthens that area as a technical pivot, because it aligns a classical structure level with a measured retracement of the prior move. In this context, acceptance above the neckline changes the immediate orderflow, while failure to hold it keeps the bearish sequence intact and favours continuation back toward lower liquidity.
Key Levels and Scenarios
For this TOTAL daily analysis, the neckline/0.618 Fibonacci confluence remains the key “line in the sand.” A bearish scenario is validated if price fails to reclaim and hold above this zone, keeping the relief move corrective and opening room for continuation lower. A bullish invalidation of the immediate bearish pressure requires sustained acceptance above the neckline, turning former resistance into support.
- Neckline level: primary support resistance pivot for continuation vs deeper correction
- 0.618 fib retracement: confluence level reinforcing the neckline decision zone
- -0.27 level: upside reference point aligned with the daily high if support holds
This analysis is for informational purposes only and does not constitute financial advice.