


This is our TOTAL daily analysis for 20 January 2026, focusing on the recent rejection at the Fib 100% level and the current reaction at ascending channel support. This technical analysis puts the latest impulsive sell-off and potential pullback into context.
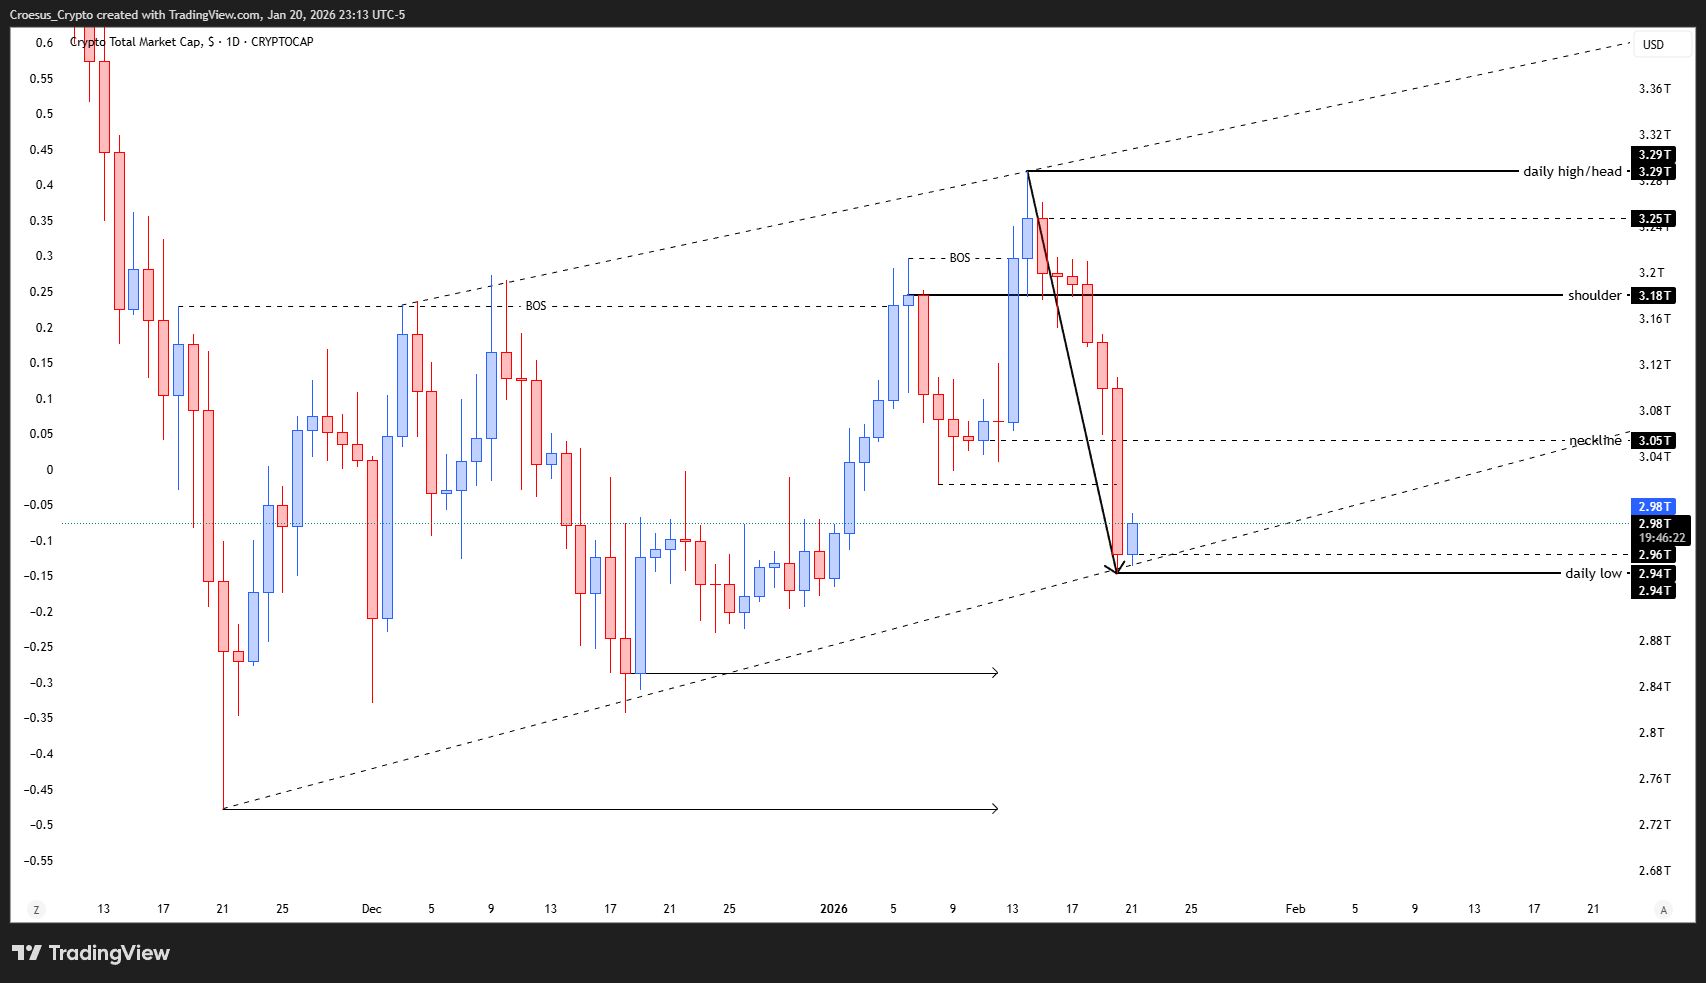
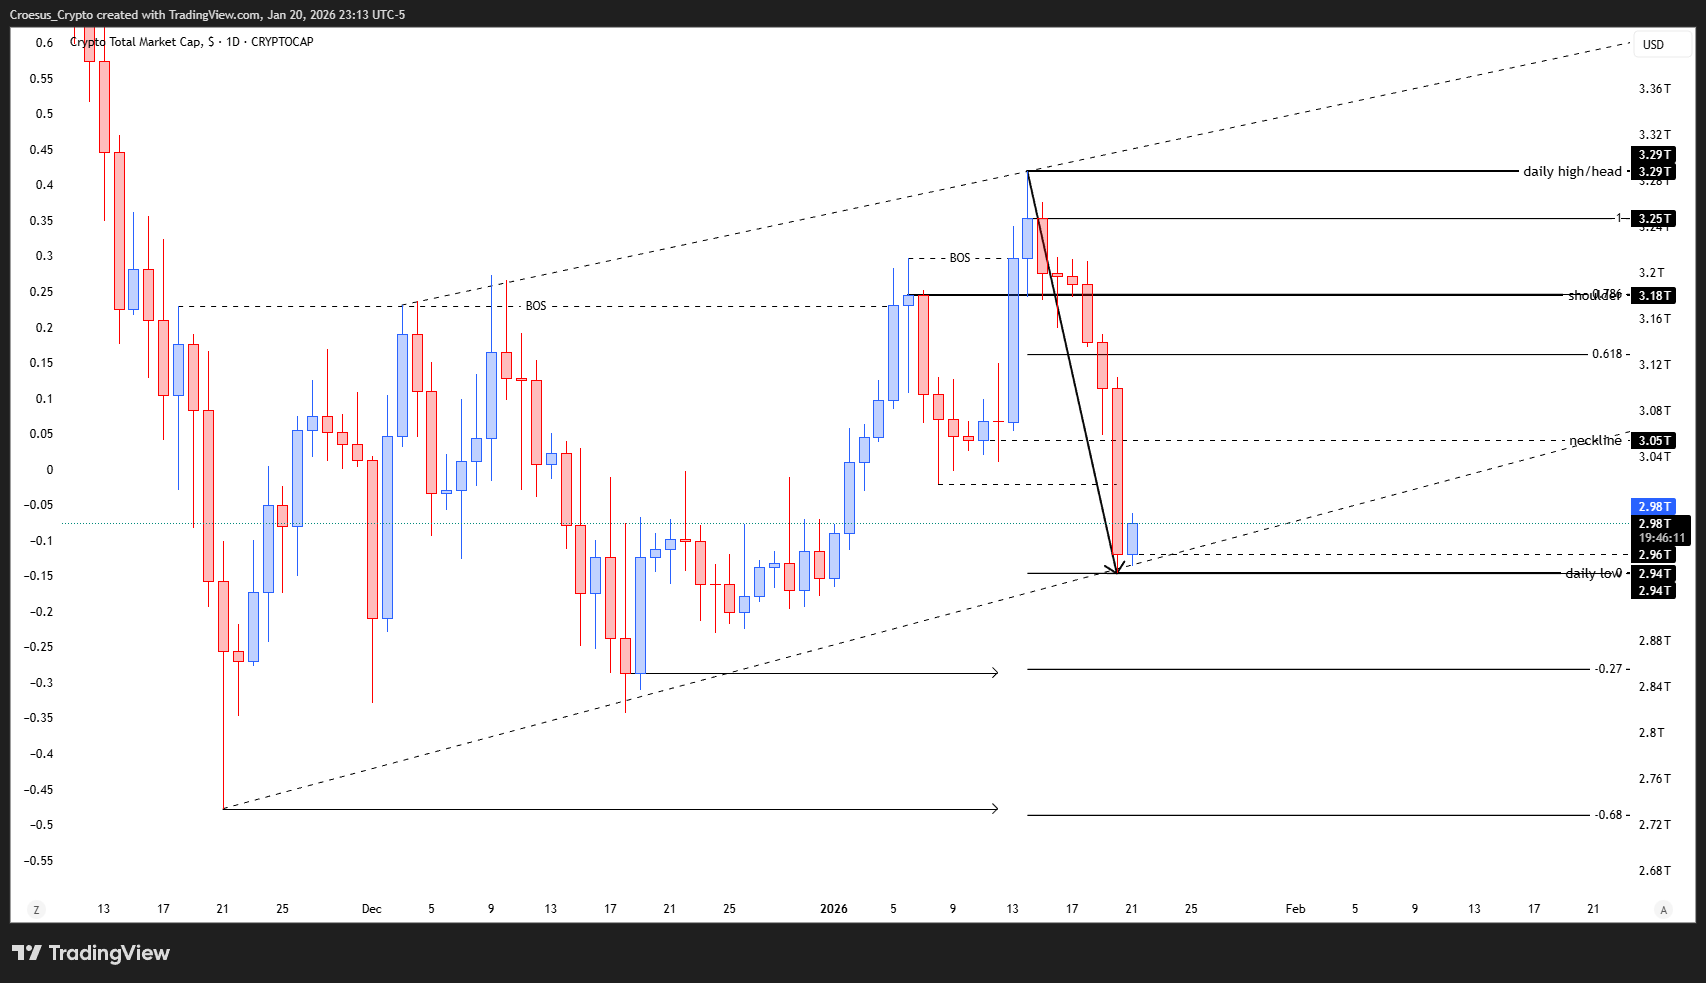
TOTAL daily chart 20 Jan 2026 with Fib 100% neckline break, prior daily high and ascending channel support.
Technical analysis
- where we said yesterday to be interested in a long position if the fib 100% showed us a bullish support, we can see that the index did not hold the fib 100% level (currently marked as the neckline).
- We saw an impulsive sell-off past the fib 100% level and the prior daily high.
- At this moment, the daily high is drawn premature, meaning that the last blue candle has to be ignored as it isn't closed yet. This candle can still close lower at the end of the day.
- Same with the fibonacci retracement. In theory we can only start drawing the fibonacci retracement once we have a confirmed candle of an other colour. At this moment, whatever we say, based on the fib retracement, would be an assumption and is only confirmed if and when the candle closes bullish.
- If we make that assumption we can see the following : the retracement level 0.786 perfectly coincides with the shoulderlevel. And the fib expansion level -0.27 and -0.68 show confluences with two keylevels, showing us that we might pullback towards the beginning of the ascending channel which is generally accepted as target of measurement of an ascending channel.
Market Structure Analysis
Our TOTAL daily analysis shows that the Fib 100% “neckline” has failed as support, confirming a short-term break in structure after price swept the prior daily high. The impulsive leg down suggests aggressive selling rather than a simple corrective pause. For now, the current blue candle and its Fibonacci retracement are provisional; any conclusions based on the retrace remain assumptions until we get a confirmed close in the opposite colour.
If that bullish close prints, the 0.786 Fibonacci retracement aligning with the shoulder level becomes an important resistance and potential lower high. At the same time, the -0.27 and -0.68 Fibonacci expansion levels lining up with key support zones indicate that the market may be targeting the early part of the ascending channel, which is commonly used as the measurement target when such a channel breaks or is fully retested.
Key Levels and Scenarios
Bullish scenario (counter-trend):
A confirmed bullish daily close from current channel support, followed by a reclaim of the neckline, opens the door for a retrace towards the 0.786 / shoulder area, where sellers are likely to defend.
Levels to watch (approximate, structure-based):
Neckline / failed Fib 100% – key resistance; needs to be reclaimed to neutralise immediate downside pressure.
Shoulder region near the 0.786 retracement – confluence resistance and potential reversal zone.
Ascending channel base – current reaction area; loss of this support validates deeper expansion targets.
Fib expansion -0.27 – first downside extension and short-term profit-taking zone for bears.
Fib expansion -0.68 – deeper measured-move target aligning with major support within the broader channel.
Trading Implications
Given the impulsive nature of the sell-off, we treat the trend as short-term bearish until the neckline is reclaimed. Aggressive traders may look for short setups on bounces into resistance, while conservative participants wait for a confirmed bullish daily close before considering any long exposure, with tight risk management below the channel and fib expansion levels.
This is not financial advice; always do your own research and manage risk accordingly. The structure of this analysis follows our internal trade plan framework