


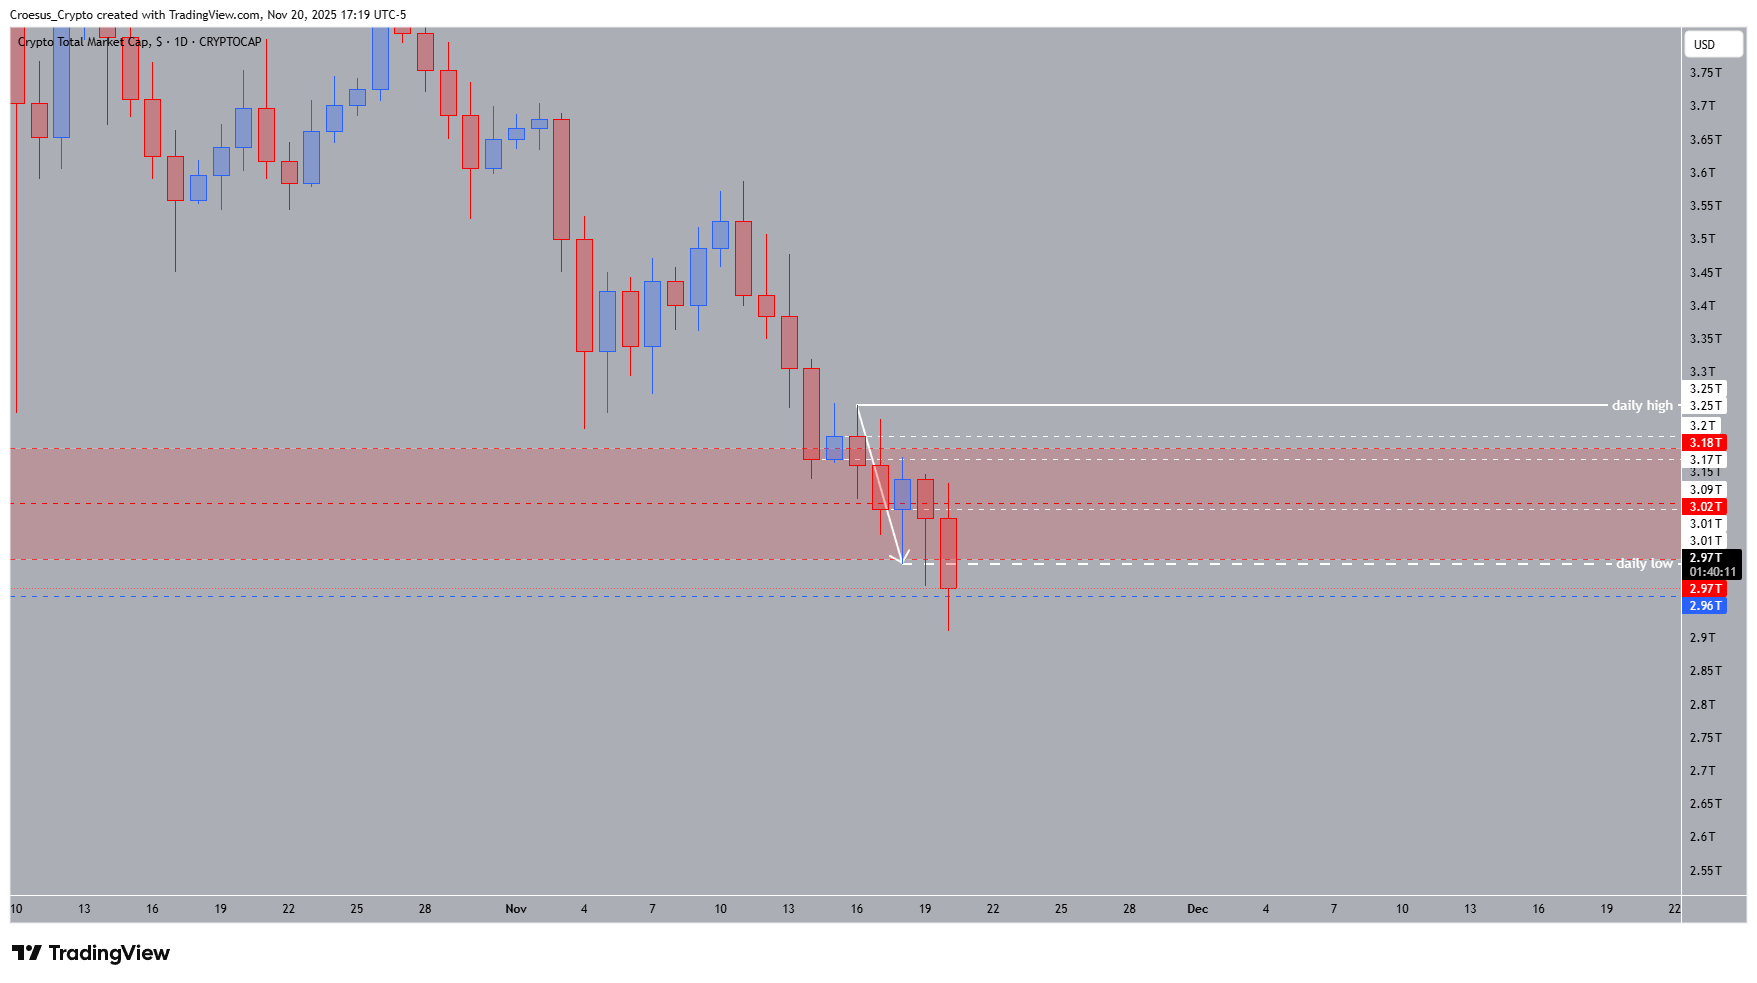
TOTAL daily chart 20 Nov 2025 with broken daily low at 3.01T and price trading below monthly liquidity zone.
- Trend : bearish ↓
- Daily high : 3.25T
- Daily low : 3.01T (broken)
- Technical Analysis Key Points
- Bulls retested the equilibrium of the monthly liquidity zone early today, but bears kicked backed in, pushing the index back down past the daily low, printing a new lower low. As we don't have a new bullish reaction, the low is not confirmed yet.
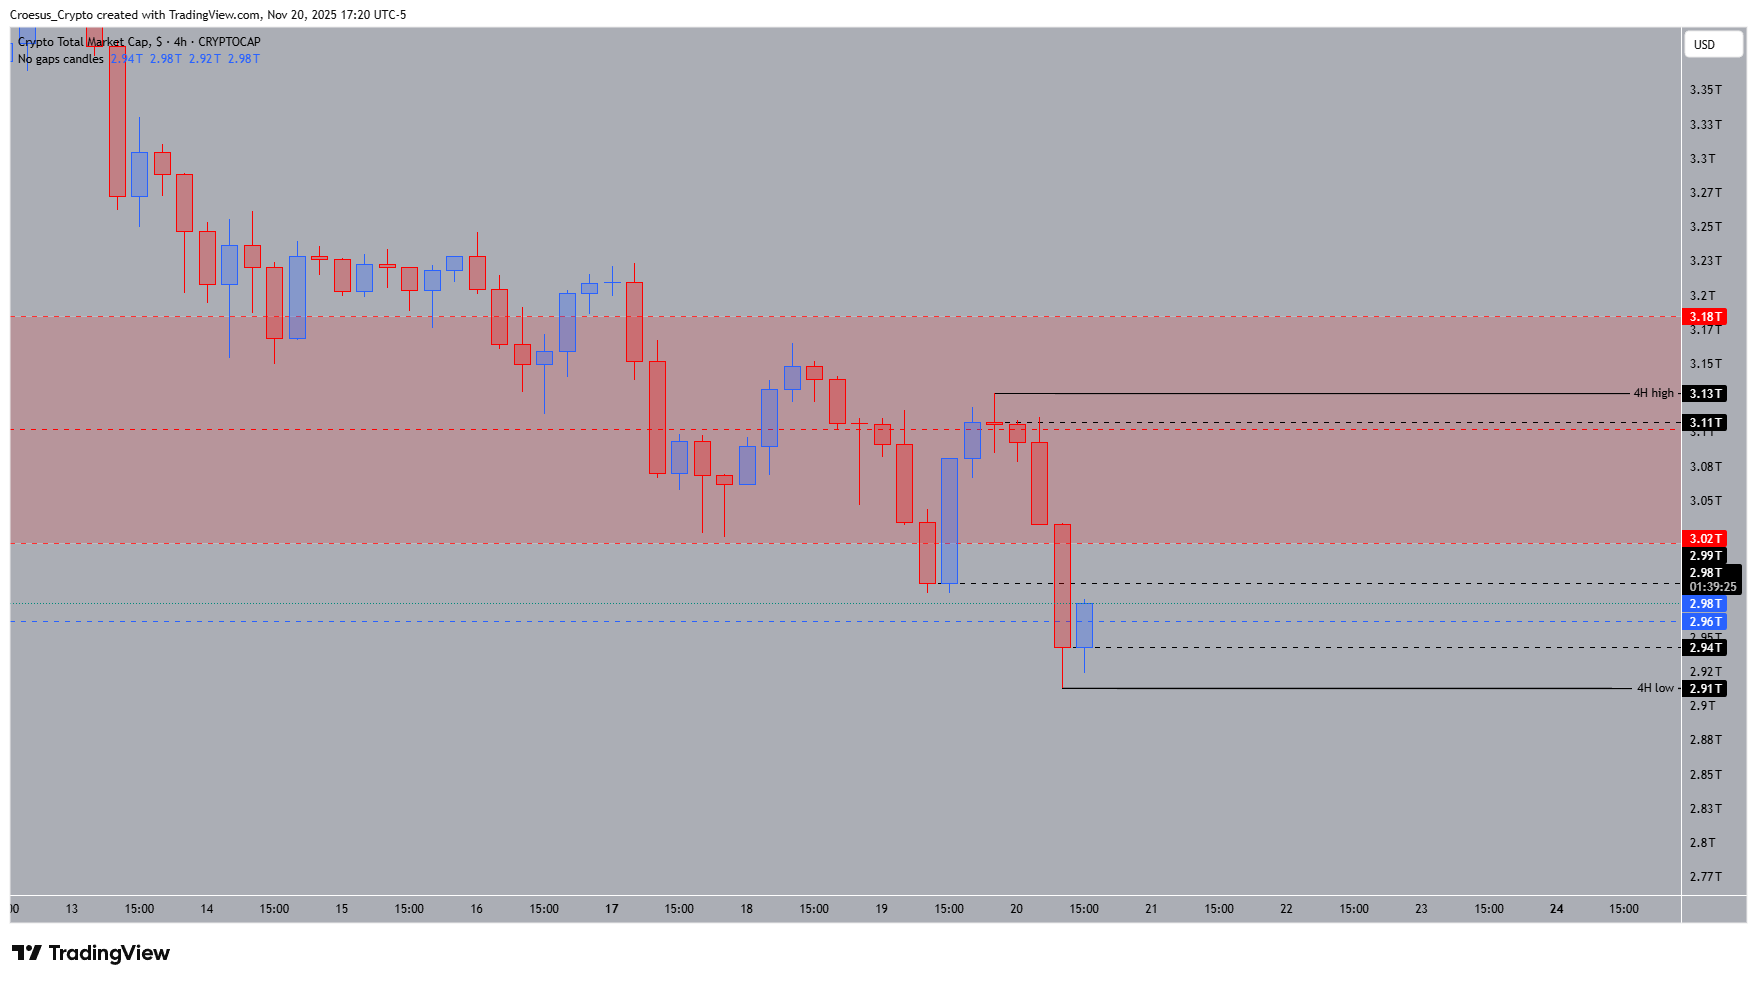
- If we zoom in on the 4H timeframe, we still remain bearish, printing again a new lower low, breaking the low of the monthly liquidity zone.
- Although the index moves below the monthly liquidity zone, it remains a monthly zone. There are still 10 days remaining, where the monthly zone and preferably the monthly low @ 3.18T can be reclaimed.
- But still no signs of reversal. Patience remains key ! Wait for confirmation !
TOTAL 4H chart 20 Nov 2025 with monthly liquidity zone, bearish structure and new lower low below daily low.
Market Structure Analysis
From a market structure perspective, this TOTAL daily analysis confirms a sequence of lower lows and lower highs on both the daily and 4H timeframes, aligning with our bearish trend view. The break below the daily low at 3.01T signals continuation of downside momentum and shows sellers firmly in control. On the 4H chart, the new lower low extends this bearish leg, pushing price beneath the lower boundary of the monthly liquidity zone.
Despite price trading below that zone, it still acts as a key reference for technical analysis until the monthly candle closes. A reclaim of the monthly low near 3.18T would be the first sign that buyers are willing to absorb supply. Until then, horizontal support resistance levels around 3.01T and 3.18T dominate our view, with no clear Fibonacci confluence to offset the current bearish bias.
Key Levels and Scenarios
Bullish scenario (requires confirmation)
Bullish scenario (counter-trend): only if TOTAL reclaims 3.01T on a daily closing basis and pushes back into the monthly liquidity zone, with follow-through above 3.18T opening room for a squeeze toward the daily high at 3.25T.
Critical levels to watch:
3.25T – Daily high: main upside objective if buyers regain control.
3.18T – Monthly low: pivotal resistance; reclaim would weaken the bearish case.
3.01T – Broken daily low: former support now acting as resistance; key for trend bias.
Current unconfirmed low below 3.01T: potential short-term support but not valid until a strong bullish reaction prints.
Trading Implications
For now, our analysis favors patience: aggressive traders may focus on short setups on bounces into 3.01T–3.18T, while conservative traders should wait for a clear daily reversal signal and confirmed higher low before considering fresh long exposure, always sizing positions modestly relative to volatility.
3.25T: Break of structure trigger
Disclaimer: This content is for educational purposes only and is not financial advice; always do your own research and manage your own risk.