


TOTAL Marketcap / Crypto Total Market Cap
TOTAL daily analysis 20-05-2026. TOTAL is consolidating after a bearish leg down, and our technical analysis stays cautious as price pauses in a tight zone that can resolve with volatility expansion in either direction.
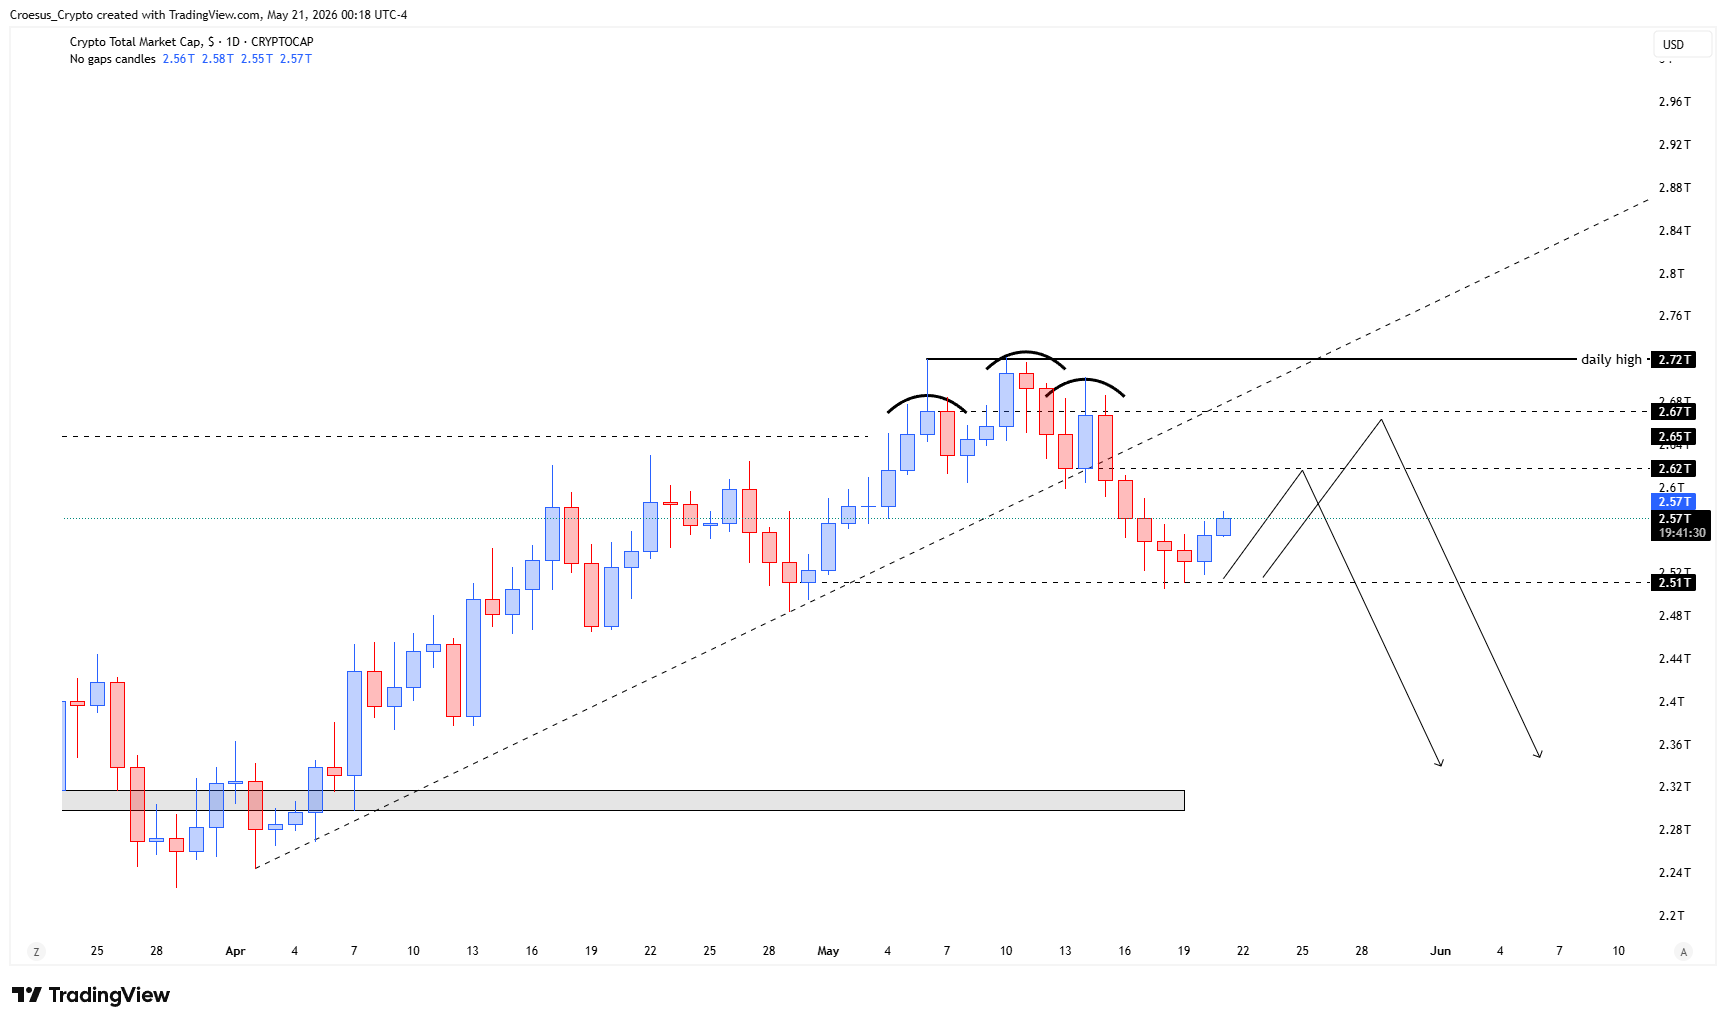
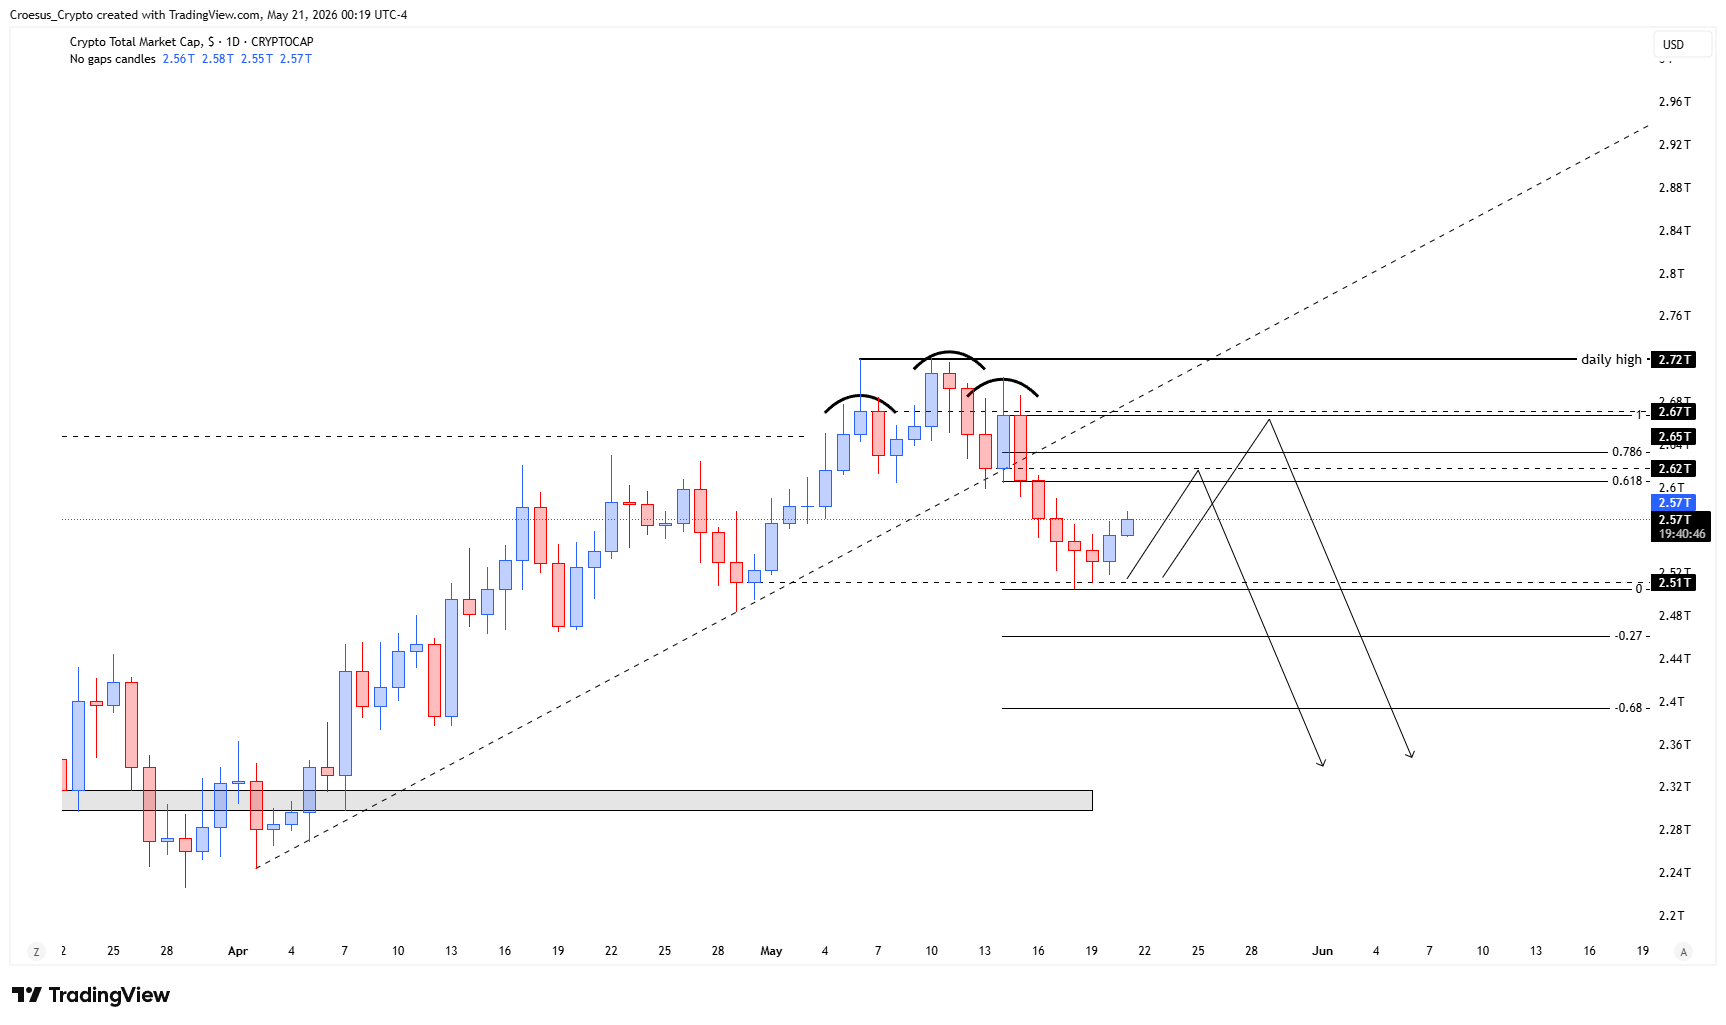
- TOTAL printed its first bullish candle after a bearish leg down, starting a local relief, possibly back to prior highs.
Market Structure Analysis
Structurally, the market just transitioned from a clear impulsive selloff into a potential corrective structure, highlighted by the first bullish candle after the bearish leg. In a bearish context, this type of response often signals a relief phase rather than a confirmed reversal, especially while price is still consolidating and hasn’t reclaimed key prior structure.
From a naked-trading perspective, the main read is that sellers have paused and liquidity is building inside a developing range. Until we see a clean break of structure to the upside, the broader bias remains bearish, with resistance likely sitting at the “prior highs” referenced in the draft and support defined by the most recent swing low/base of the selloff.
Key Levels and Scenarios
For the bullish scenario, TOTAL needs continuation from this consolidation and a reclaim of the prior-high resistance zone to confirm the relief move is expanding into a larger corrective retrace. For the bearish scenario, rejection from overhead resistance followed by a breakdown from the consolidation range would suggest the downtrend is resuming.
- Consolidation range high (near-term resistance that must break for continuation)
- Consolidation range low (near-term support; loss shifts focus back to downside)
- Prior highs (major overhead resistance / corrective target zone)
- Recent swing low (bearish continuation trigger if taken)
Trading Implications
In this TOTAL daily analysis, the current zone is structurally sensitive: aggressive traders typically focus on range resolution, while conservative traders often wait for confirmation via break of structure and a clean retest. Risk remains elevated because consolidation after an impulsive leg can resolve sharply in either direction around nearby support resistance.
This analysis is for informational purposes only and does not constitute financial advice.