


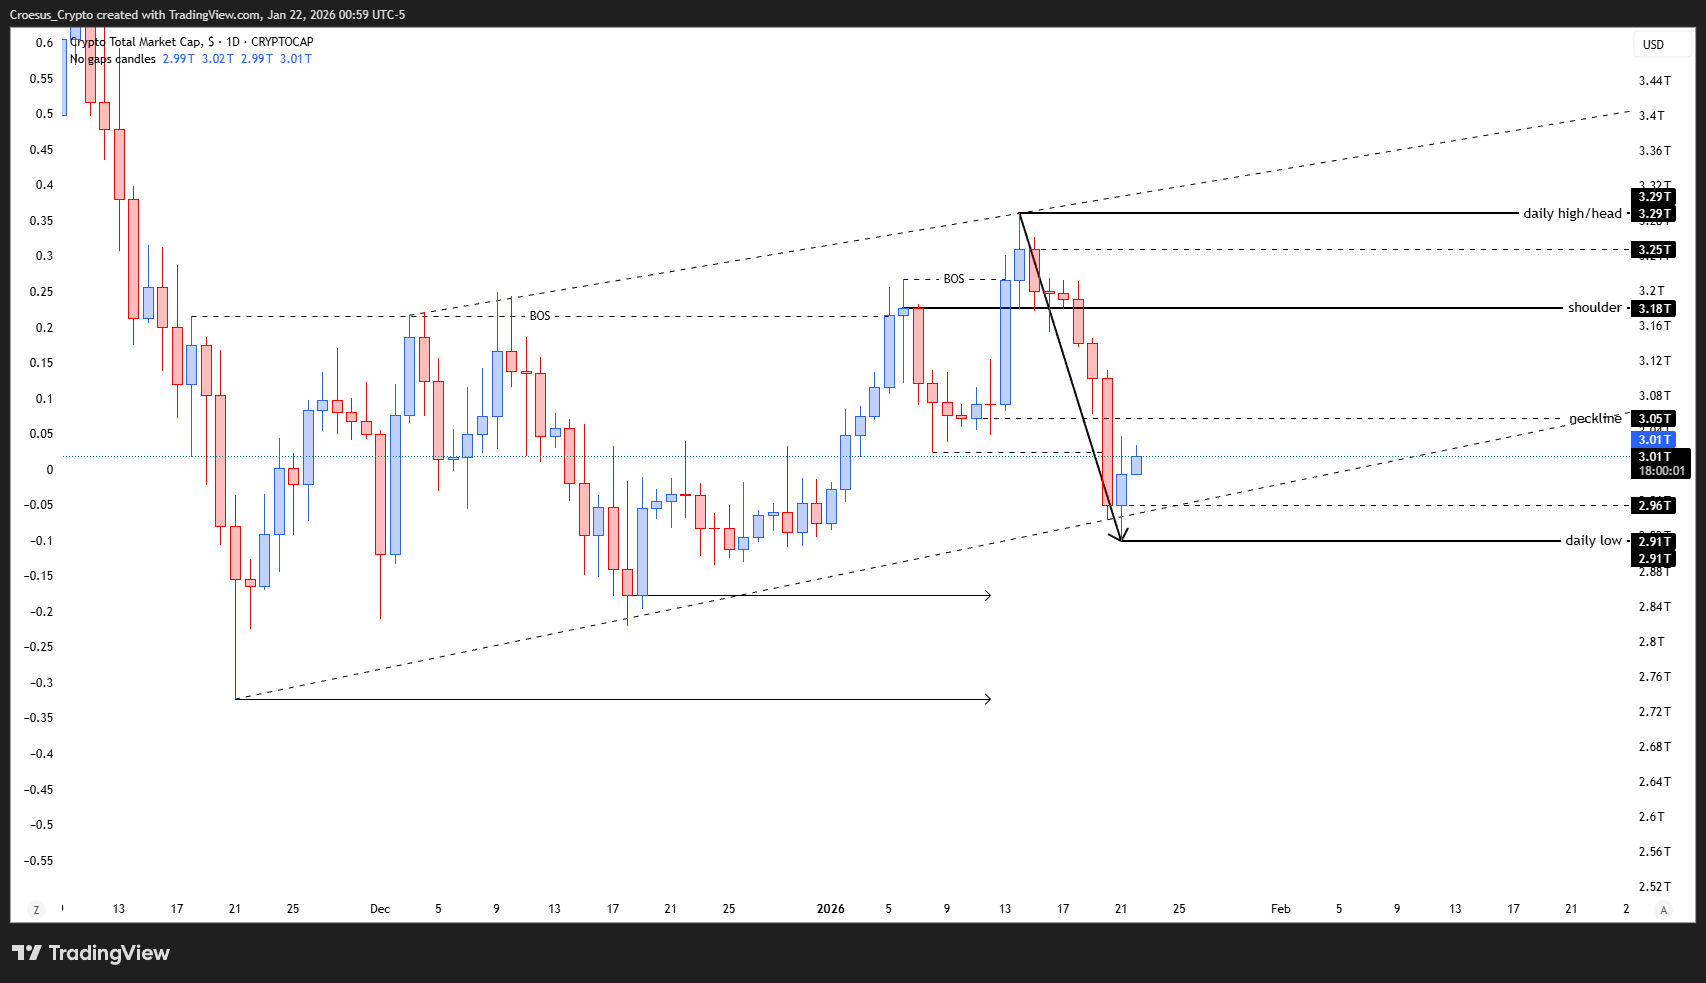
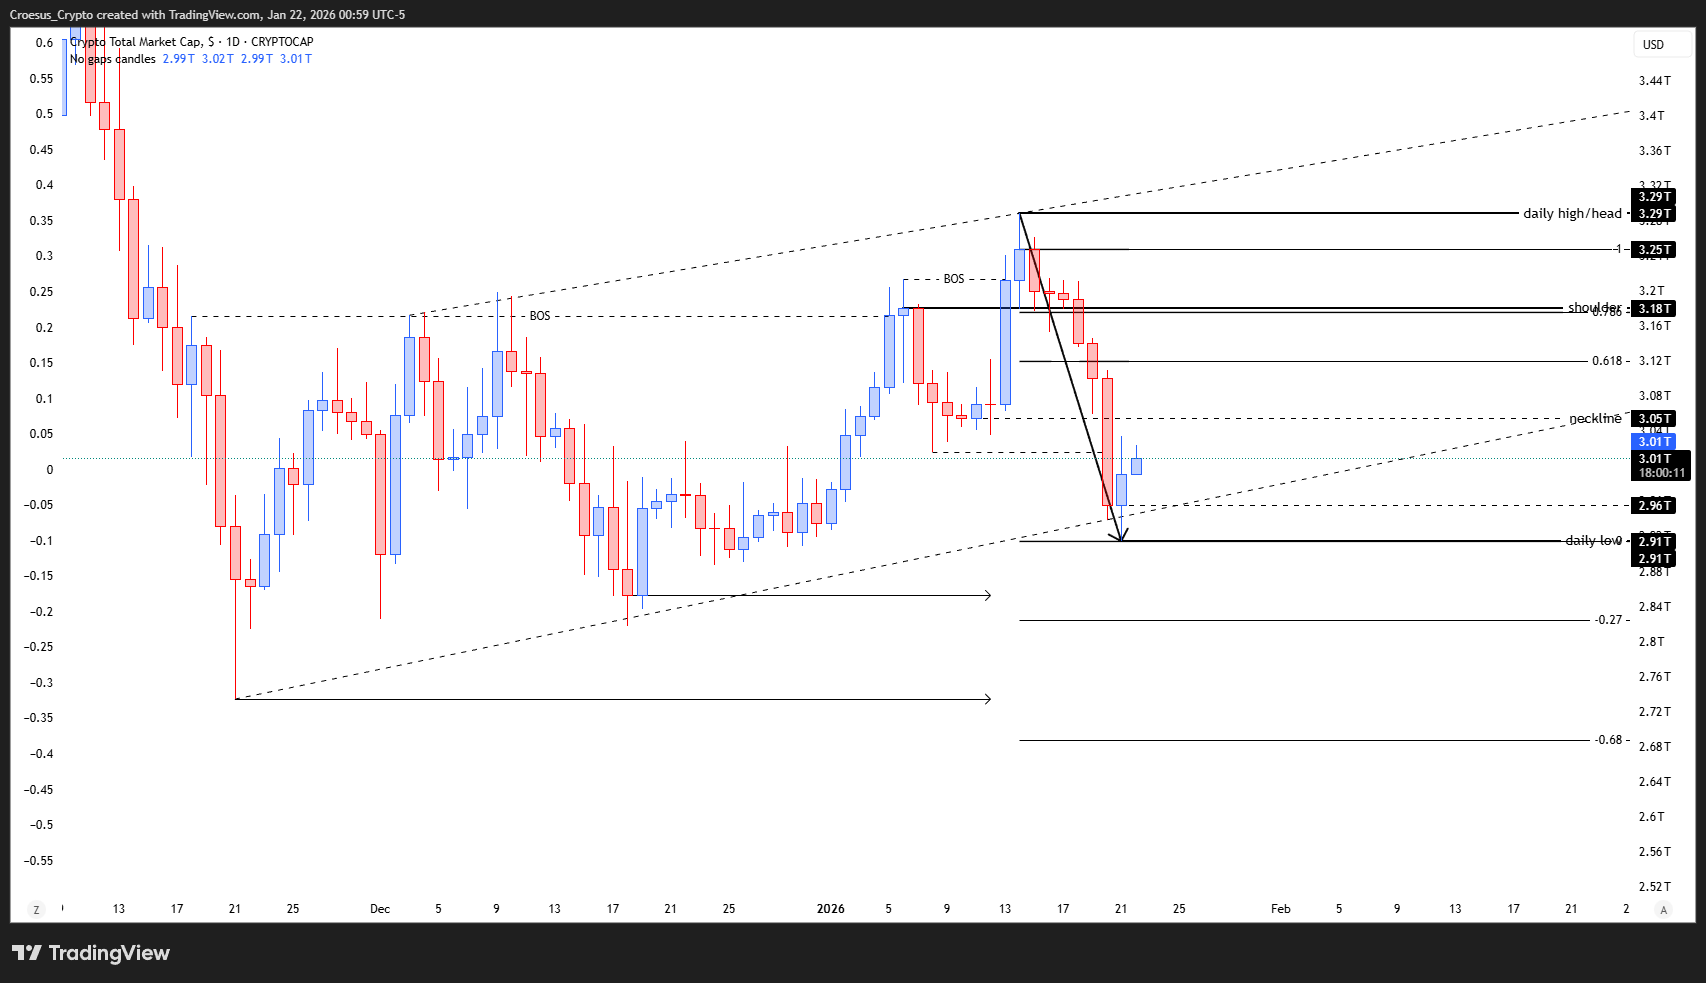
The TOTAL daily analysis for 21 January 2026 shows the market cap extending the downside leg of the current correction before buyers stepped in and printed a bullish daily candle around the lower part of the channel structure. This provides a clearer swing high–to–swing low range to anchor our Fibonacci retracement and refine support resistance zones for the ongoing corrective move.
TOTAL daily chart 21 January 2026 with rising channel, daily high/head, shoulder, neckline and daily low levels
Technical analysis
- The index pushed a little further down but finished with a bullish candle.
- This mean that we can draw our fib retracement now.
- The correction is continuing as analysed.
Market Structure Analysis
Price is still trading inside the broader ascending channel, but the recent impulsive drop from the “daily high/head” around the 3.29T area broke back below the shoulder region near 3.18T and retested the neckline zone around 3.05T. The follow-through selling pushed into the 2.91T “daily low” area, where demand reacted and formed today’s bullish candle. With this clear high–low structure in place, our technical analysis can now track the correction using Fibonacci retracement levels: the 0.618 retracement sits just above 3.10T, aligning with prior structure and reinforcing it as first major resistance on any bounce. As long as price remains below the neckline and 0.618 cluster, we treat this as a corrective move within a larger range rather than a confirmed trend reversal.
Key Levels and Scenarios
Bullish scenario: If the market defends the 2.91T daily low and pushes back above the 3.05T neckline and the 0.618 Fibonacci zone near 3.10–3.12T, we could see continuation towards the shoulder and head highs (3.18T and 3.29T).
Levels to watch
2.91T – Daily low: Primary support; loss of this level opens room towards the lower channel.
≈2.96T – Local reaction zone: Minor intraday support from the most recent bounce.
3.01T – Current area: Mid-range pivot; intraday bias flips around here.
3.05T – Neckline: First key resistance and decision point for bulls.
3.10–3.12T – 0.618 Fibonacci retracement: Confluence resistance; a break and hold above would strengthen the bullish recovery case.
Trading Implications
For active traders, the higher-probability approach is to wait for either clear rejection from the neckline/0.618 zone to trade with the correction, or a confirmed reclaim of that area to target the shoulder and head highs, with stops placed beyond the invalidation of the chosen scenario.
This is not financial advice; always do your own research and manage risk accordingly. The structure of this analysis follows our internal trade plan framework