


This TOTAL daily analysis for 22 December 2025 focuses on a market that has been trapped in the same daily range for about a month after the last impulsive bearish move. Our technical analysis shows that, while a short-term “Santa Run” looks likely, the dominant trend remains bearish with support resistance levels still intact and no structural break yet.
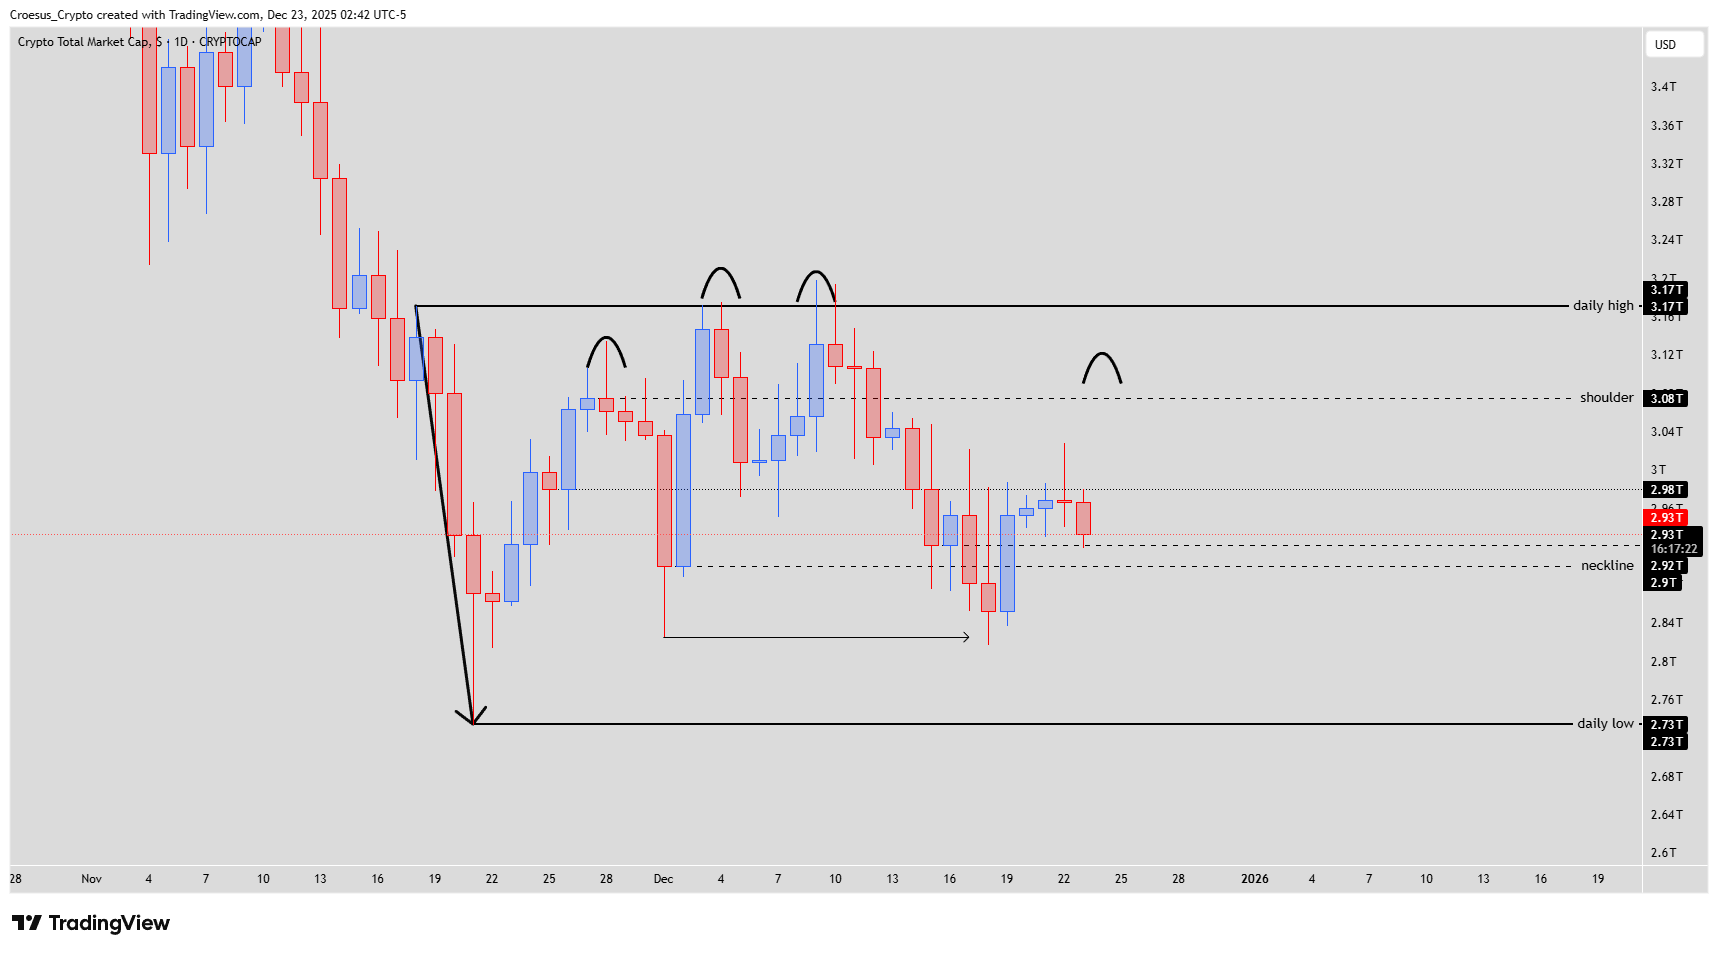
TOTAL daily chart 18 Dec 2025 with head and shoulders structure, neckline and fake-out zone
Technical analysis
- The index is trading for 30 days (!) within the same daily range, defined by the last impulsive bearish move (3 candles). What the bears took 3 days to cover, the bulls haven't achieved it in 1 month ! No signs of any bullish behaviour yet.
- Remark : as the crypto is dominated by institutes this cycle, we have to take into consideration that the stock markets are closed for the holiday. The retail is in game at this moment. Small and choppy movements. Retail wants a Santa Run, we are going to see one. But is that rally sustained ?
- Last week on Thursday we saw the index sweep the prior fractal low, so bullish correction was to be expected.
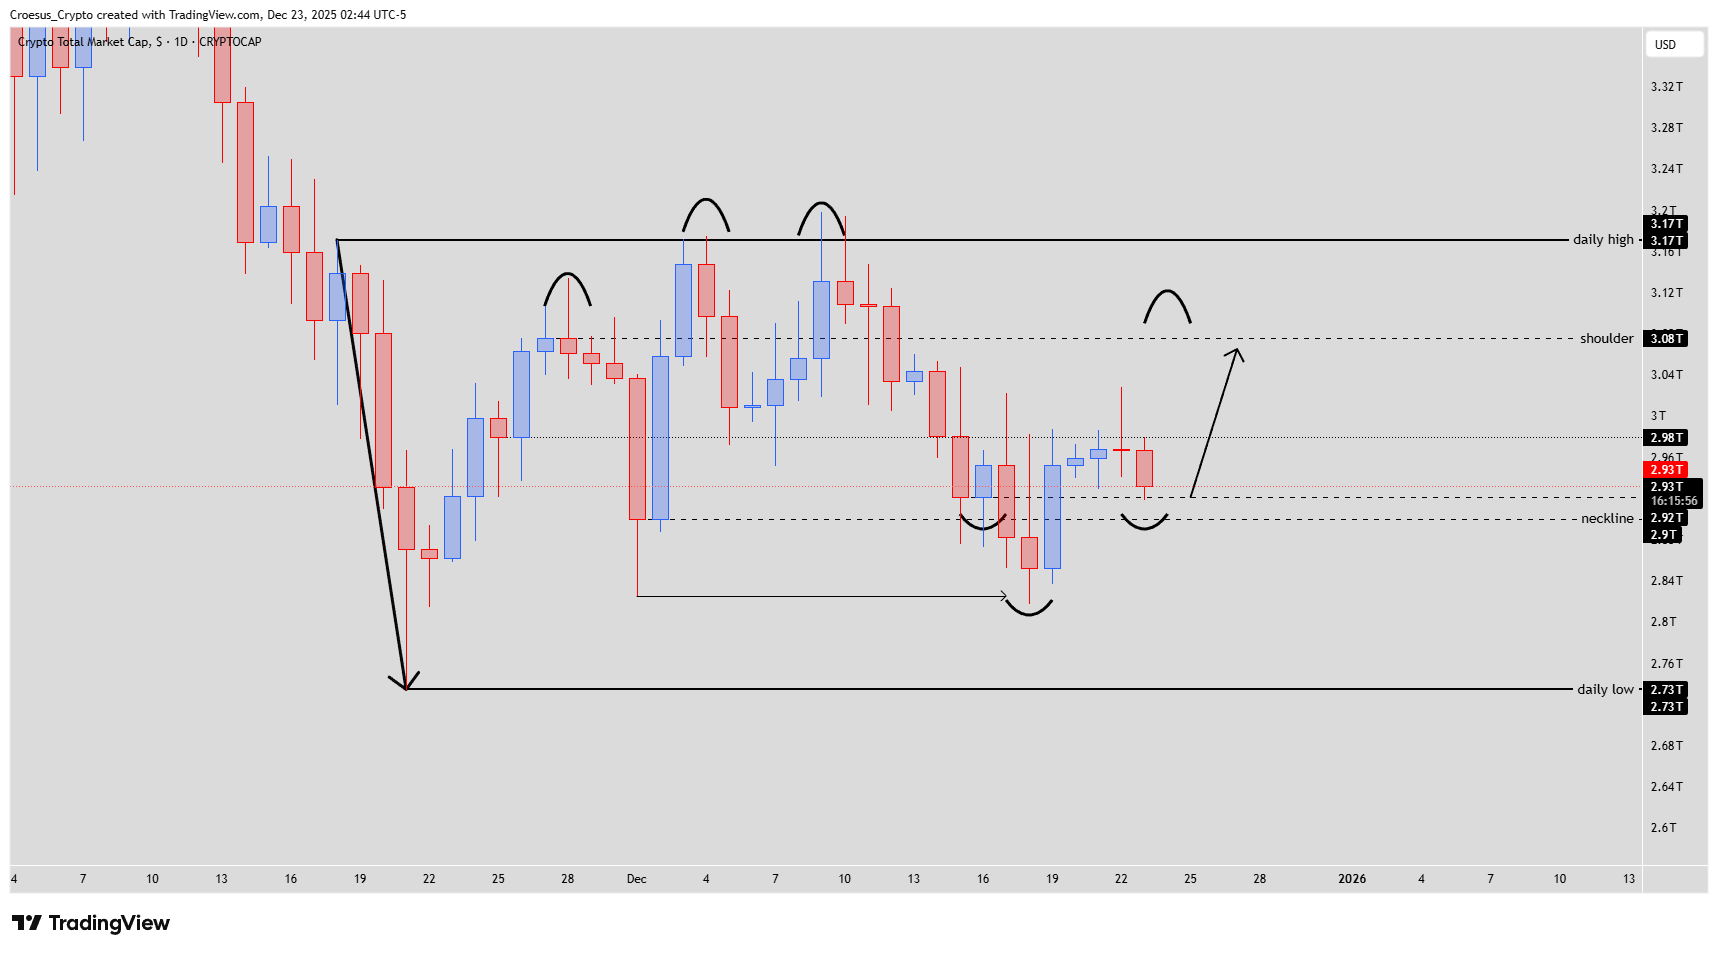
- At this moment we see a bullish fractal reversal pattern (inverse head & shoulders).
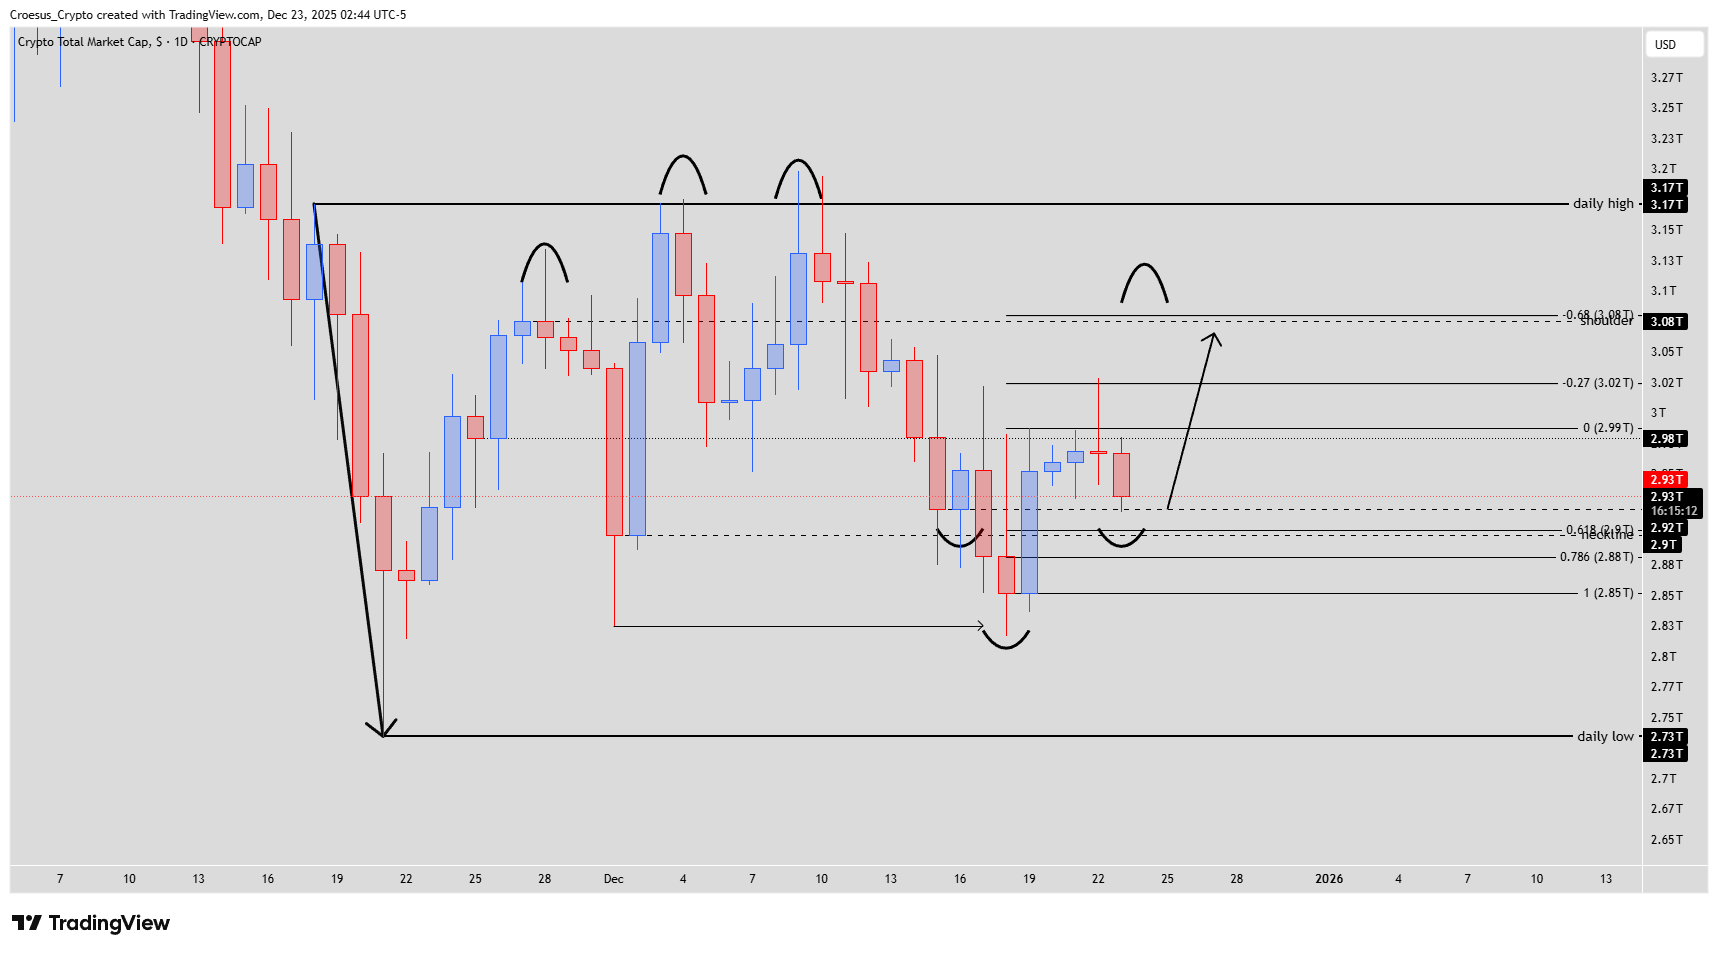
- If we take the Fibonacci retracement, we see the fib level -0.68 at the bigger shoulder level.
- Therefore a "Santa Run" of about 5% is to be expected. But take into account : as long as we don't see a break structure, we are still bearish and this move is countertrend, thus higher risk.
Market Structure Analysis
Our TOTAL daily analysis shows price locked between the daily low around 2.73T and the daily high near 3.17T after a sharp three-candle selloff. Bears pushed this distance in three days; bulls have spent about 30 days failing to reclaim that range high, confirming weak upside momentum.
The sweep of the prior fractal low triggered the current bounce and helped shape an fractal inverse head & shoulders near the neckline around 2.9T. This aligns with classic technical analysis, where a liquidity grab below support often precedes a corrective move higher. However, with institutional activity muted by stock market holidays, retail-driven, choppy price action dominates, making the pattern less reliable.
Key Levels and Scenarios
Bullish scenario: A short-term “Santa Run” of roughly 5% toward the bigger shoulder area is plausible while the inverse head & shoulders plays out and the Fibonacci -0.68 level is tested. This remains a countertrend move unless structure breaks convincingly above range resistance.
Key support resistance levels to watch:
2.73T – daily low and key downside invalidation of the current bounce.
≈2.85T–2.88T – lower Fibonacci zone; loss of this area weakens the inverse H&S.
≈2.90T – neckline region; needs to hold as support for further upside.
≈2.99T–3.02T – mid-range/Fibonacci cluster where sellers may reappear.
3.08T (shoulder) – aligns with Fibonacci -0.68; primary upside target for the Santa Run inside the bearish range.
Trading Implications
For active traders, this countertrend rally offers opportunity but with elevated risk: position sizes should remain smaller, stops can be placed below the neckline or recent fractal low, and any longs should be treated as short-term trades until a clear break of structure above the shoulder and ultimately the 3.17T daily high confirms a broader trend reversal.
This is not financial advice; always do your own research and manage risk accordingly. The structure of this analysis follows our internal trade plan framework