


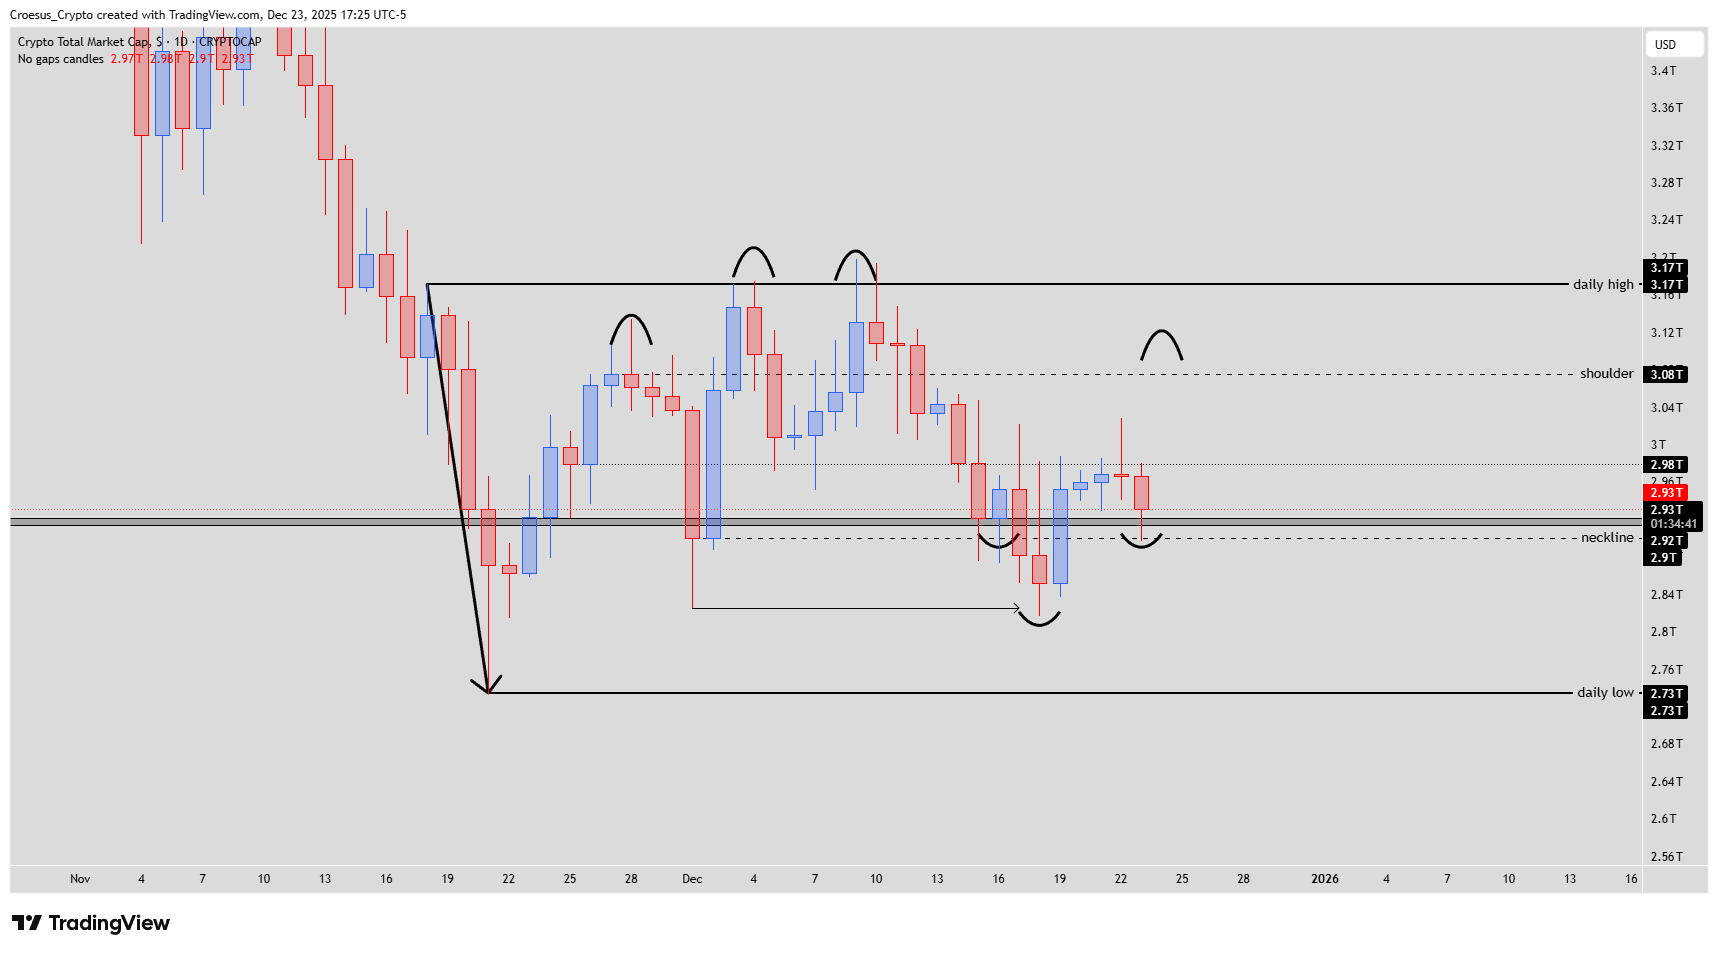
TOTAL daily analysis for 23 December 2025 shows the market working on a potential reversal structure after the recent sell-off. Our technical analysis focuses on the developing inverse head & shoulders and the ongoing support reaction around the shoulder area near 2.93T, which is being defended again.
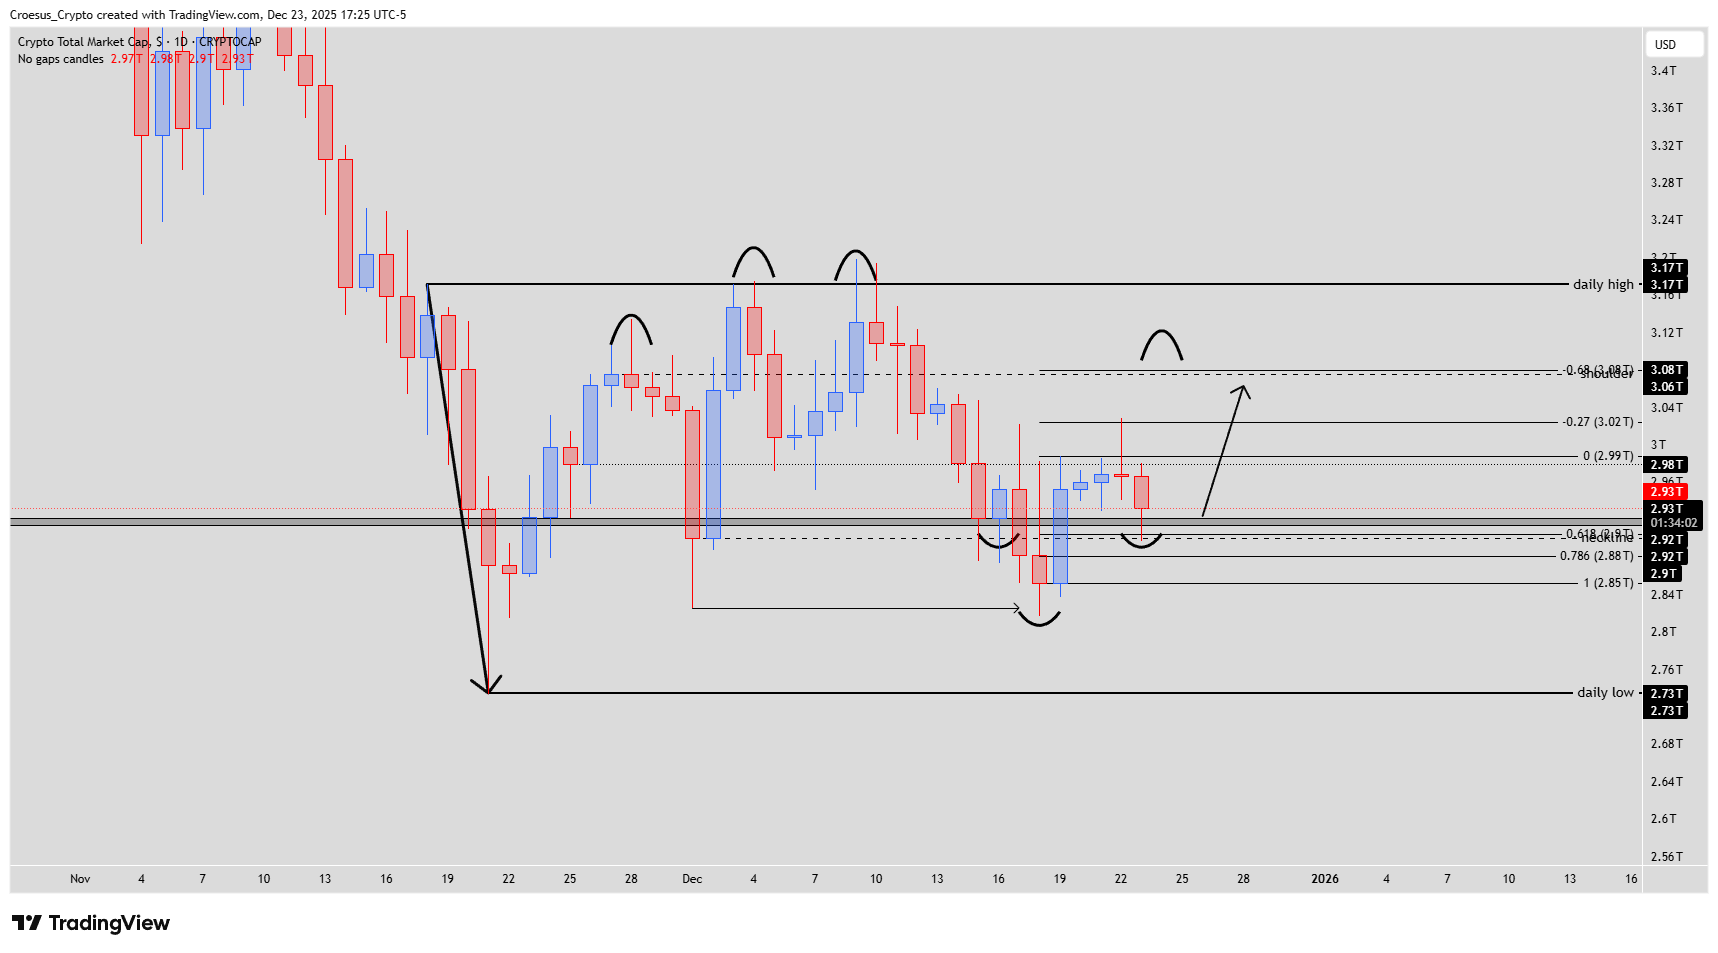
TOTAL daily chart Dec 23 2025 with inverse head and shoulders setup, 2.93T retest, and resistance toward 3.08T/3.17T
Technical analysis
- The last days we already marked that we could possibly see an inverse head & shoulder being printed.
- Today we saw the shoulderlevel @ 2.93T being retested.
- If we take the fibonacci retracement we can see that the -0.68 level is confluent with the shoulderlevel of the larger head and shoulderlevel.
Market Structure Analysis
In this TOTAL daily analysis, the key read is whether the 2.93T shoulder area can hold as a base while price rebuilds back into prior structure. The chart highlights a nearby neckline zone around 2.92–2.93T, with Fibonacci levels adding context for where supply may step in during a bounce. The clearest upside “checkpoints” are the 2.99T–3.02T region (structure reclaim) and the 3.08T area (marked shoulder + Fibonacci confluence), which currently acts as the main resistance shelf.
Key Levels and Scenarios
Bullish scenario: If TOTAL holds 2.93T and reclaims 2.99T–3.02T, we look for a push into 3.08T first. A clean break above 3.08T opens 3.17T (daily high), roughly +8.2% from 2.93T.
Critical levels to watch
3.17T: Daily high / upside objective if momentum follows through
3.08T: “Shoulder” resistance + Fibonacci confluence (-0.68)
2.99T–3.02T: First reclaim zone (short-term support resistance flip area)
2.92T–2.93T: Neckline / shoulder support zone (must hold for the setup)
2.85T & 2.73T: Lower supports if 2.93T fails (risk extension)
Trading Implications
From a trading perspective, the daily reaction zone has now been hit, with price successfully retesting the 2.93T shoulder level. This opens the door to long-side opportunities, but only via lower-timeframe confirmation. Our focus shifts to the 4H timeframe, where a fitting entry model (such as a deceleration, inverse head and shoulder or bullish M) is required to justify participation.
It is critical to note that this setup remains countertrend, as the prevailing higher-timeframe structure is still bearish. As a result, this trade carries elevated risk and should be treated as a reactionary long, not a trend-following position. Risk and position management must therefore be tight, with clearly defined invalidation below the 2.92T neckline. Position sizing should remain conservative until the market proves strength through a reclaim of 2.99T–3.02T, and ultimately 3.08T.
This is not financial advice; always do your own research and manage risk accordingly. The structure of this analysis follows our internal trade plan framework