


TOTAL Marketcap / Crypto Total Market Cap
Our TOTAL daily analysis for 23 February 2026 focuses on the ongoing corrective leg after the sharp drop earlier in the month. Price continues to slide within an ABC correction, approaching key Fibonacci support while still trading above the recent daily low and weekly low area. This technical analysis keeps the corrective structure in focus and maps out the main support resistance zones that matter for the next sessions.
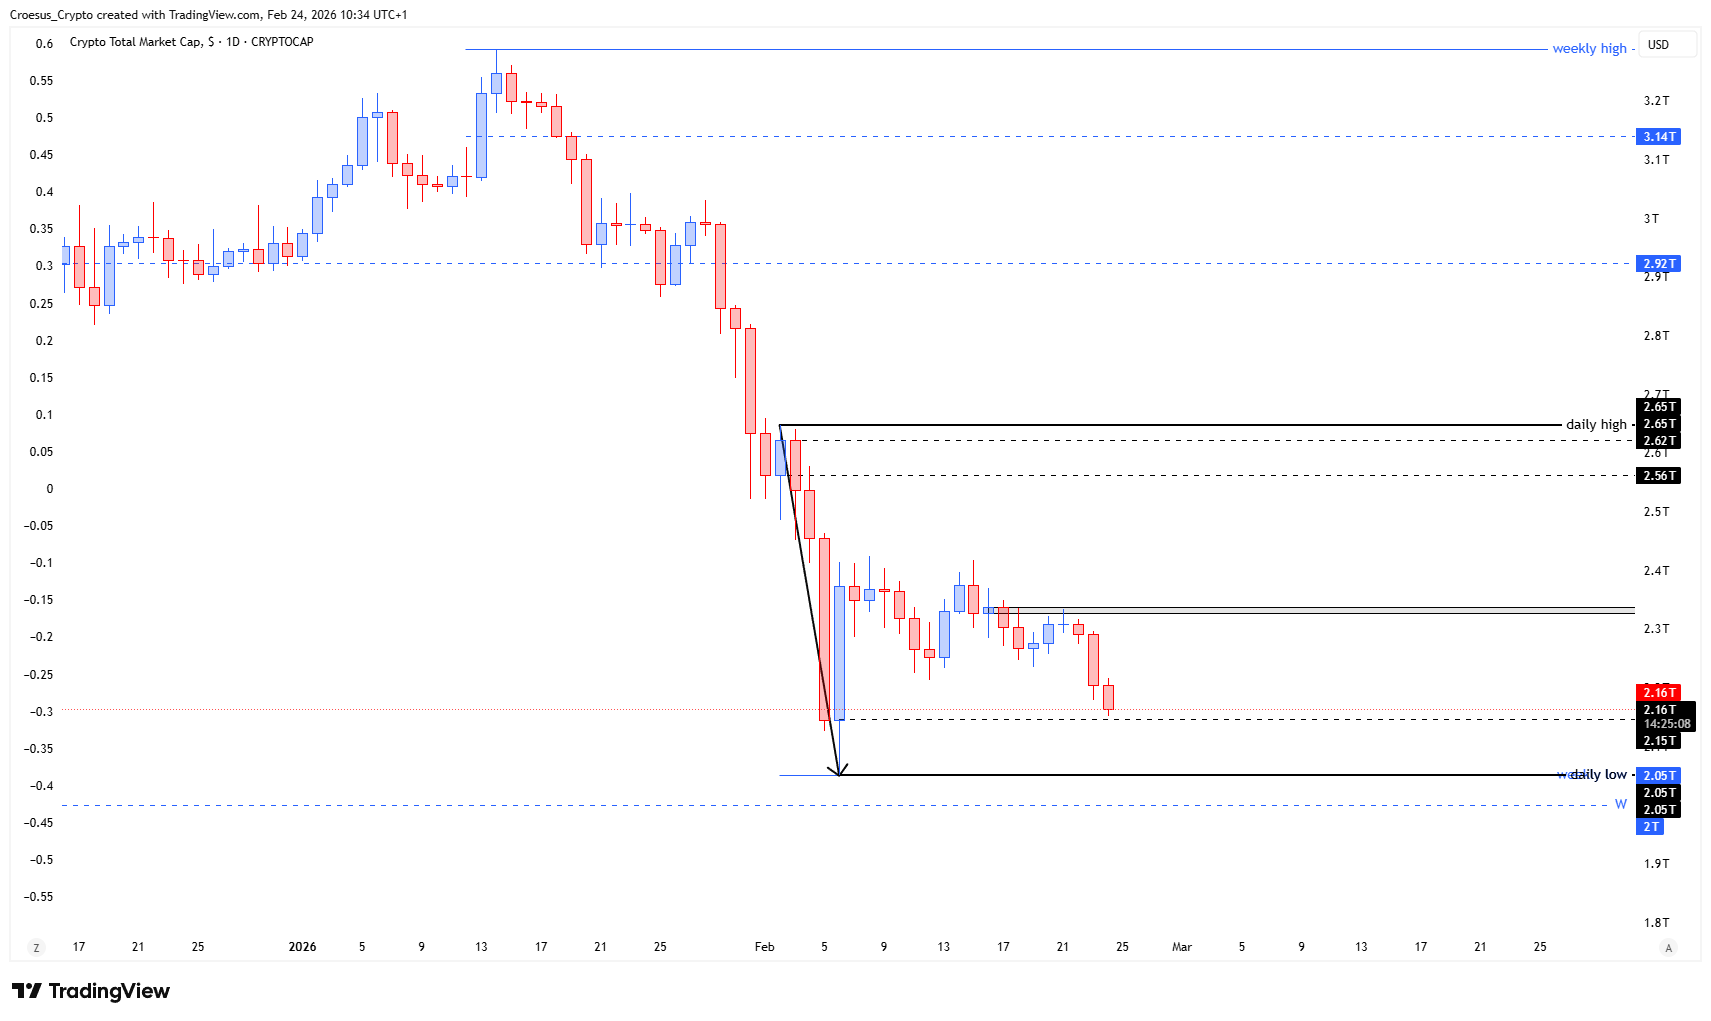
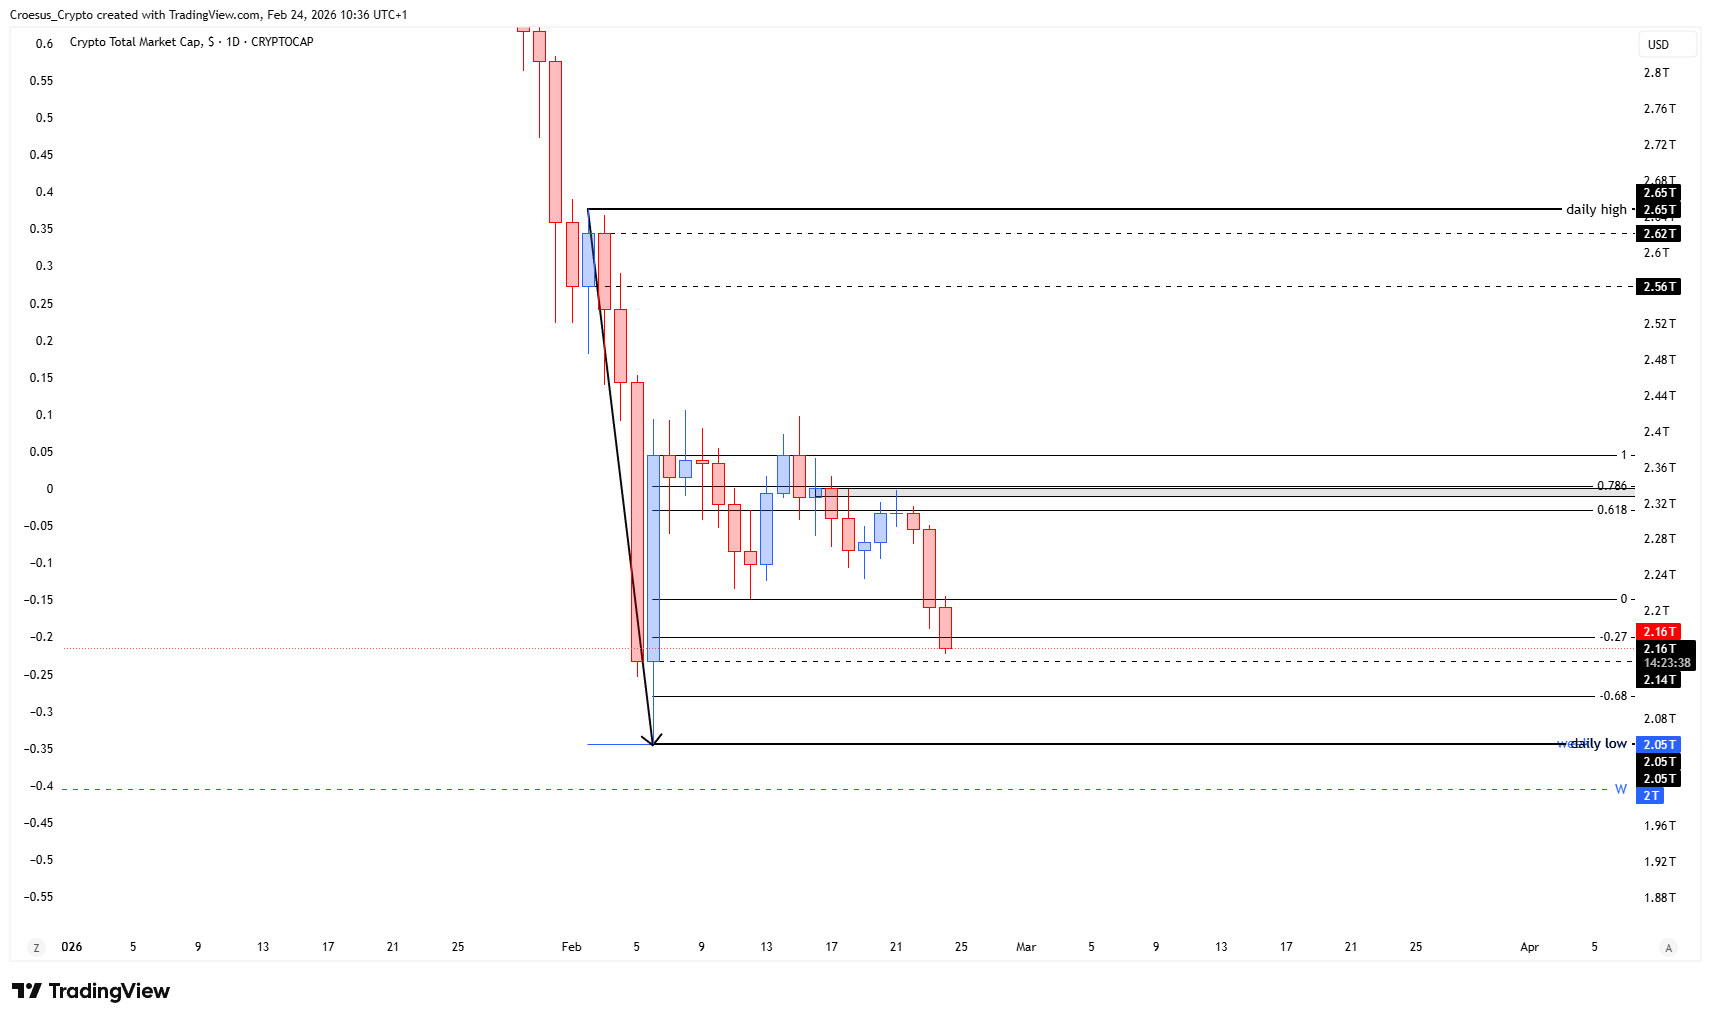
- TOTAL is correcting further.
- But ABC correction remains in play. Lign in the sand is a close below the daily low, but first point of interest is the fib level -0.68 @2.11T.
Market Structure Analysis
From a market structure perspective, this TOTAL daily analysis still treats the recent price action as an ABC corrective move against the prior impulse. As long as the index holds above the daily low (around the 2.05T region) the ABC pattern remains valid and the move is classified as corrective rather than a fresh impulsive leg lower. The -0.68 Fibonacci extension at 2.11T is our first structural demand area, sitting just above the daily and weekly lows near 2.05T and 2.0T.
A daily close below that “line in the sand” would confirm a break of current support, open room for a deeper retrace into the weekly liquidity zone, and invalidate the current corrective reading of the technical analysis.
Key Levels and Scenarios
Bullish scenario:
For active traders, we see better reward-to-risk waiting for price reaction at 2.11T: look for clear bullish confirmation before considering longs, with risk defined below the daily low; aggressive shorts only make sense on a firm daily close through that level, targeting the weekly low region.
Critical levels to watch:
- 2.11T – Fibonacci -0.68 extension: first downside target and potential bounce zone.
- ~2.05T – Daily low: invalidation level for the current ABC correction; close below turns structure more bearish.
- ~2.0T – Weekly low area: deeper support where larger-timeframe buyers may step in if daily support fails.
Trading Implications
For active traders, we see better reward-to-risk waiting for price reaction at 2.11T: look for clear bullish confirmation before considering longs, with risk defined below the daily low; aggressive shorts only make sense on a firm daily close through that level, targeting the weekly low region.
This analysis is for informational purposes only and does not constitute financial advice.