TOTAL Marketcap / Crypto Total Market Cap
TOTAL daily analysis 23/03/2026. The TOTAL index is attempting to stabilise after a deeper pullback, with price now fighting to hold a reclaimed neckline as the key support/resistance pivot.
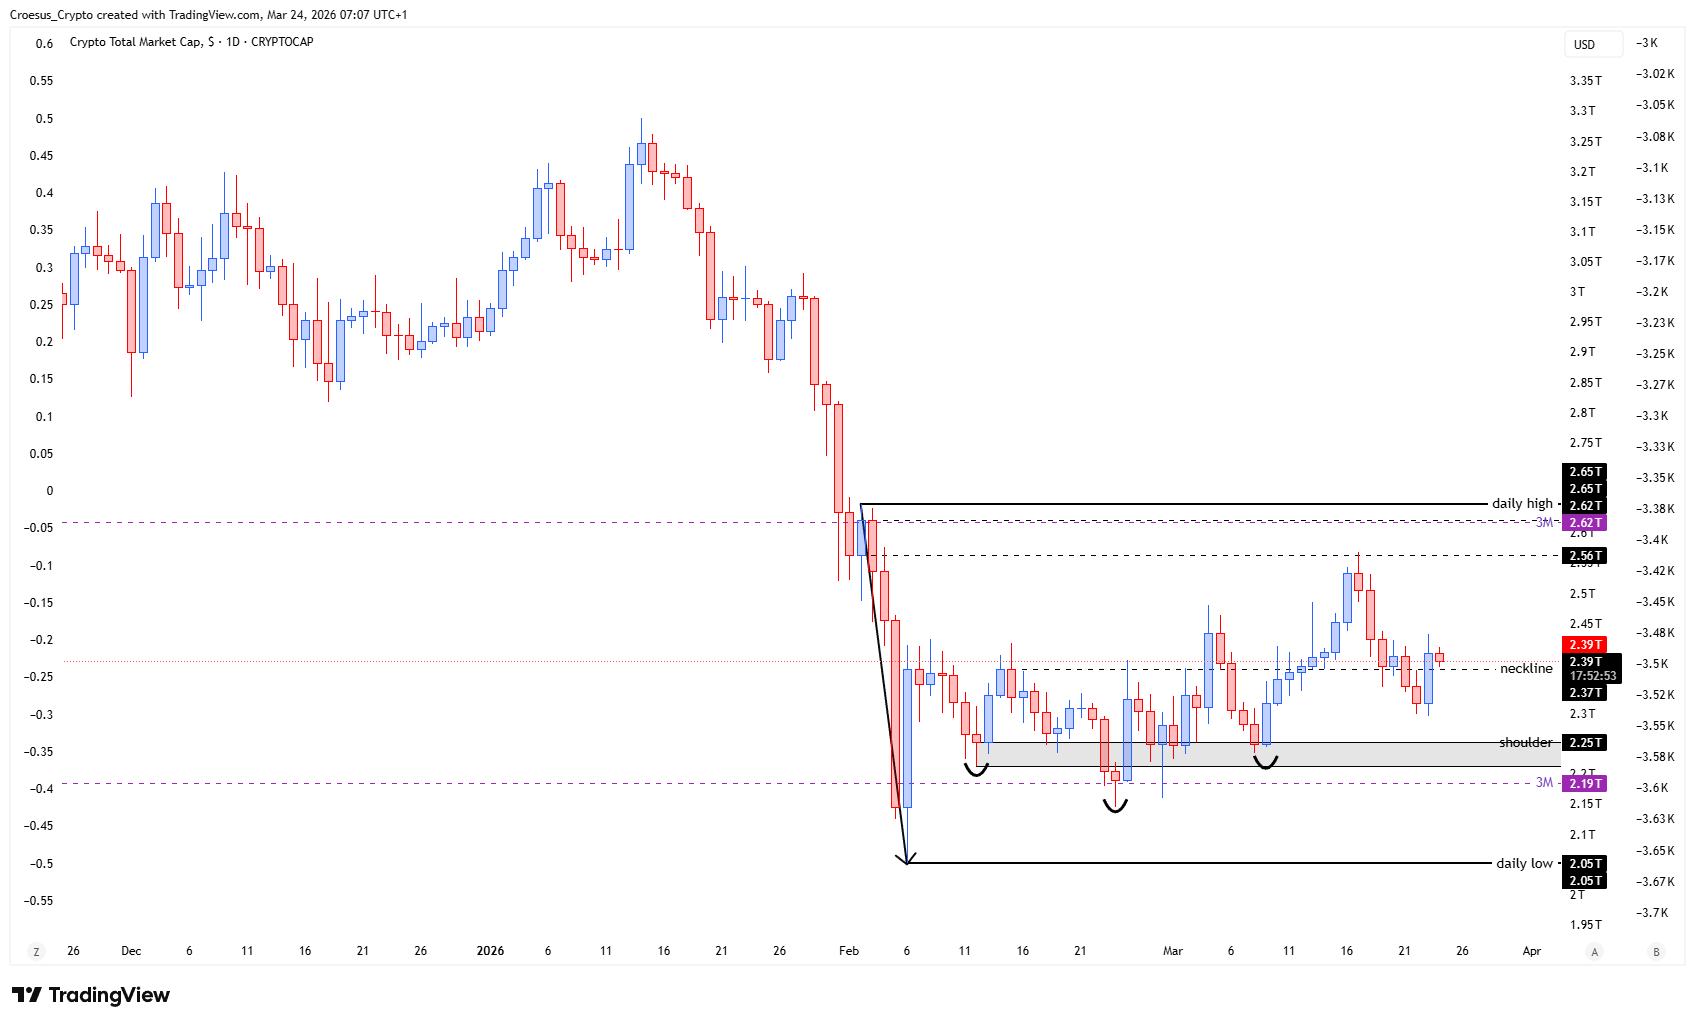
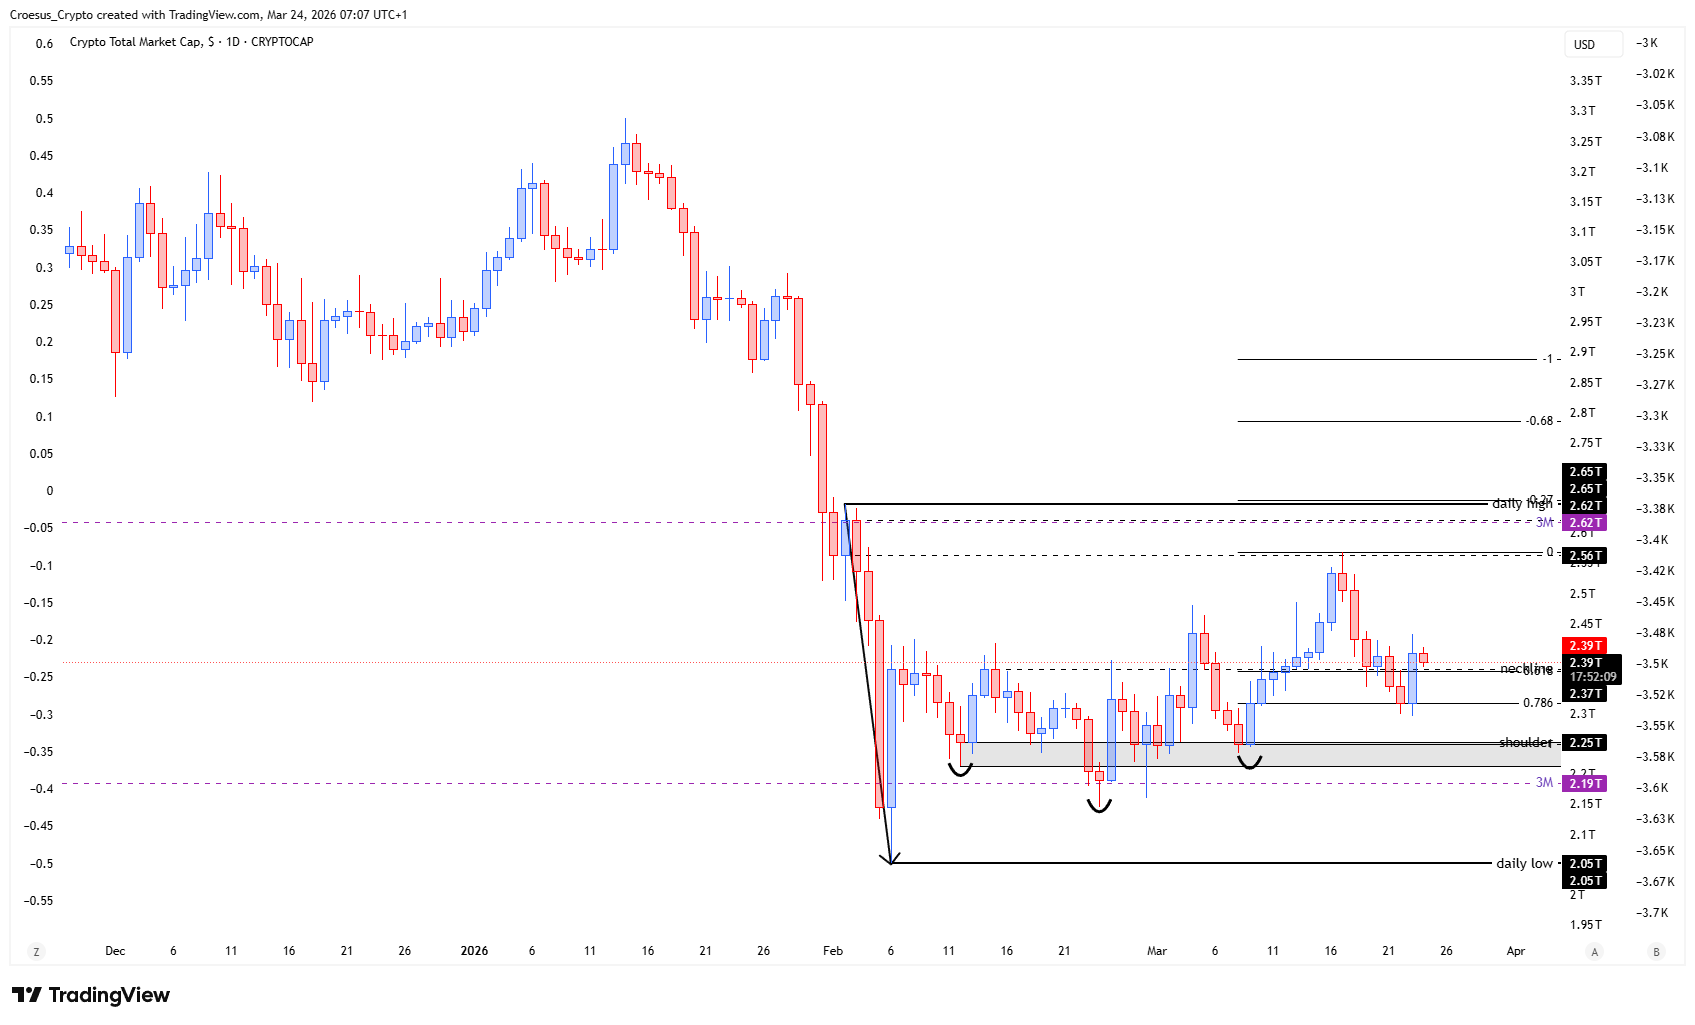
- The index shows that, after retracing towards the 0.786 Fib level, it reclaimed the neckline.
- If it could hold the neckline as support, it would confirm that the bulls are back in play again and we could see more upwards momentum towards the daily highs
Market Structure Analysis
From a naked-trading perspective, our TOTAL daily analysis focuses on whether the market is transitioning from a corrective structure back into an impulsive leg. The retrace into the 0.786 Fibonacci area signals a deeper correction, but the subsequent reclaim of the neckline is the key structural response: it suggests sellers failed to keep price below a former decision level and that demand is stepping back in.
Structurally, the neckline now becomes the most important “line in the sand” for support resistance—if price accepts above it, the market is more likely building higher lows and attempting to rotate back towards prior daily highs. If price loses the neckline again, the reclaim reads as a failed recovery within a broader bearish context.
Key Levels and Scenarios
Bullish continuation in this TOTAL daily analysis depends on holding the neckline as support and showing acceptance above it. That would keep the recovery structure intact and opens the door for a push towards the daily highs. Bearish continuation triggers if the neckline fails to hold, shifting price back into a rejection/failed-break context and putting the recent 0.786 Fibonacci retracement zone back in focus.
- Neckline level: primary support resistance pivot and validation line for the reclaim
- 0.786 Fibonacci retracement area: deeper corrective zone that underpinned the bounce
- Daily highs: upside objective if the neckline holds and momentum rebuilds
Trading Implications
Aggressive participants typically treat neckline retests as the decision point, while conservative traders often wait for clearer acceptance and continuation before positioning. With trend still labelled bearish, risk is concentrated around potential failed reclaims, so confirmation at the neckline remains the highest-value filter.
This analysis is for informational purposes only and does not constitute financial advice.