


TOTAL Marketcap / Crypto Total Market Cap
In this TOTAL daily analysis for 24 February 2026, we see the market completing a full Fibonacci 100% retracement of the previous A-leg into a key support area around the February lows. This sets the stage for a potential corrective bounce within a still-dominant bearish structure, with upside room towards the prior daily high near 2.65T.
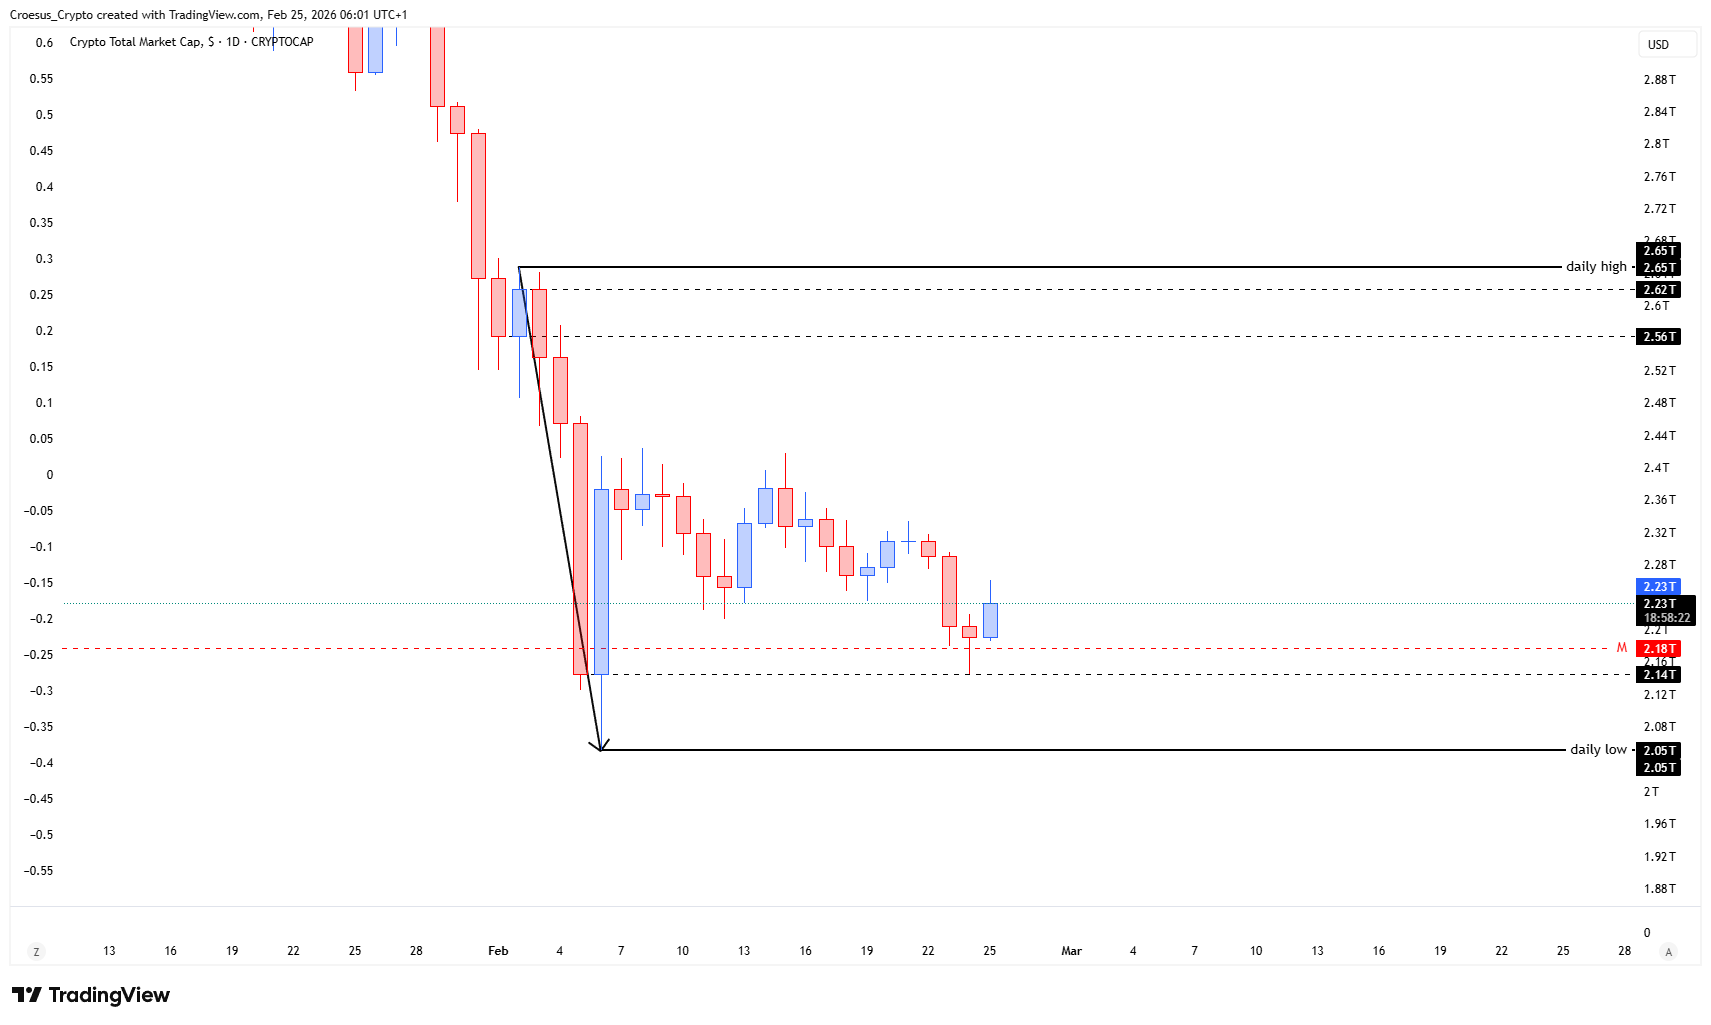
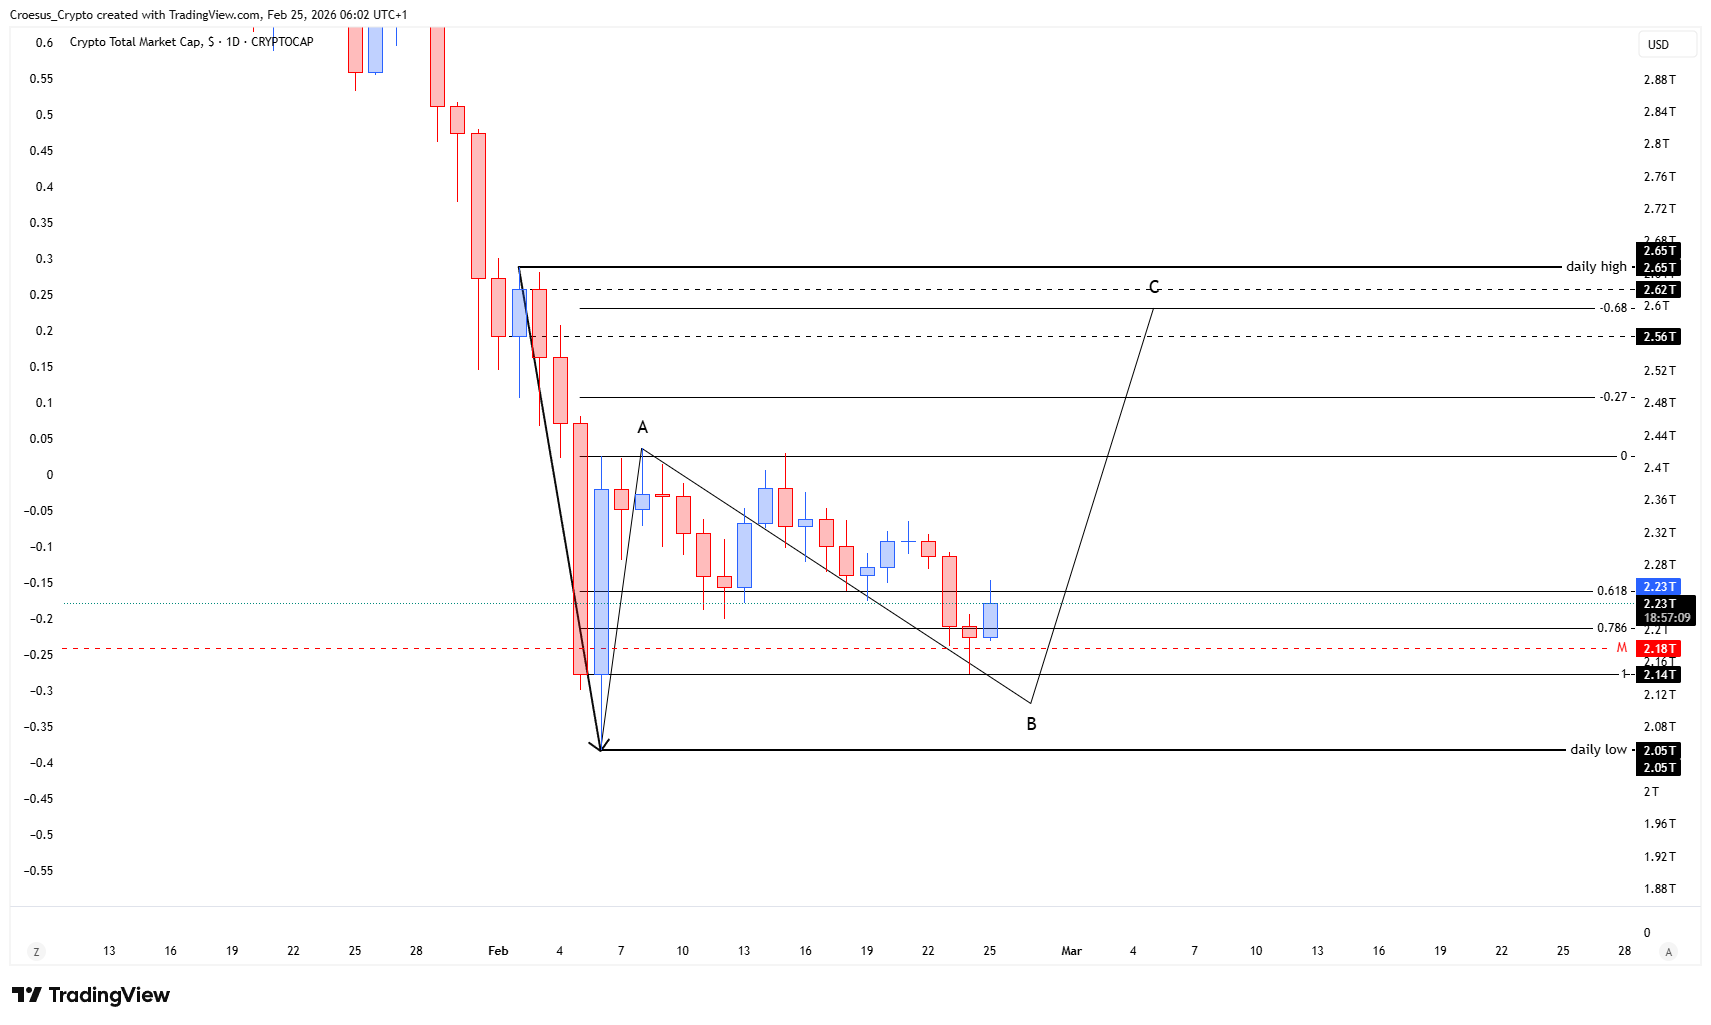
- TOTAL has made a fib 100% retracement of the A-leg, exactly on the spot.
- This could be the start of an bullish corrective move towards the daily high. Beware this is still a corrective move.
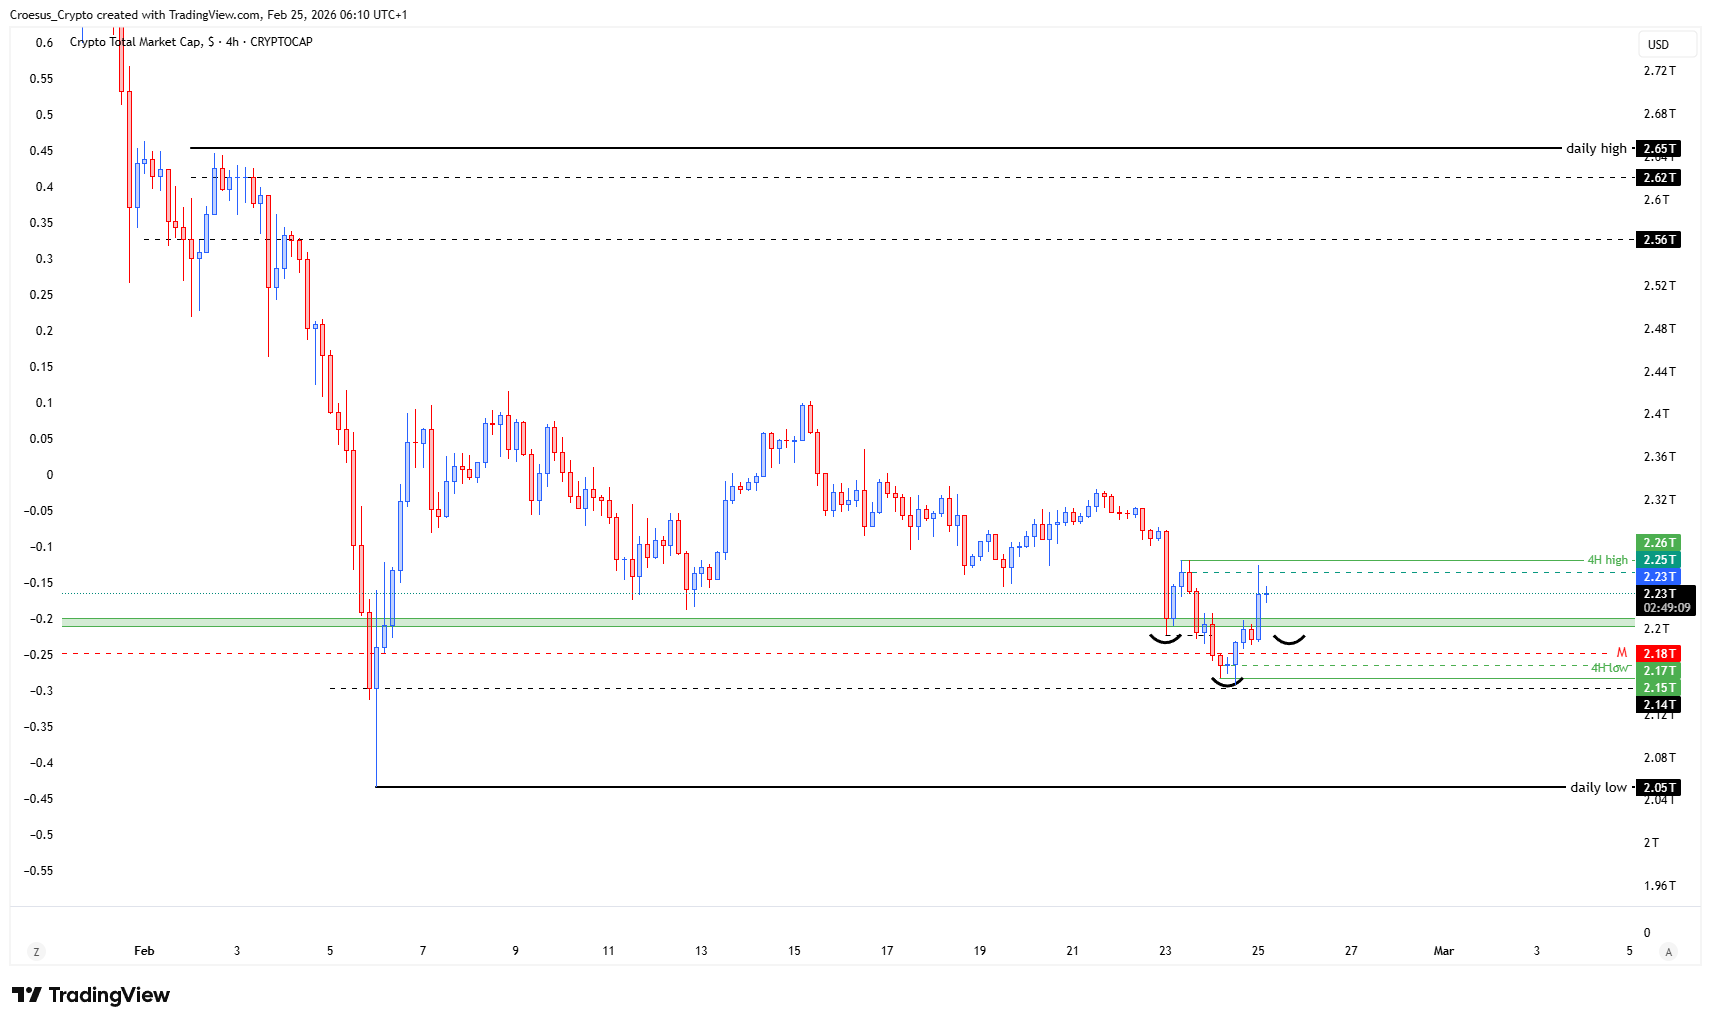
- Eventhough this is a daily analysis, we would like to share also the 4H on the detailled entry level. There we can see the development of an inversed head & shoulder pattern. But as long as the neckline is not broken, and there is no break of structure, we remain bearish. Entering upon this pattern at this moment is possible but remains higher risk.
Market Structure Analysis
Our TOTAL daily analysis highlights a classic ABC corrective structure: the market extended lower, then retraced back up in the A-leg, and has now completed a precise 100% Fibonacci retracement at point B. This confluence of previous swing low and Fib completion marks an important decision zone for market structure and support resistance.
From here, any bounce is treated as a corrective move within a broader downtrend. The main upside reference is the daily high around 2.65T, with intermediate resistance zones near the mid-range (around 2.56T) and current consolidation levels. On the 4H, the developing inverse head & shoulders offers a tactical long setup, but until the neckline and local structure highs are broken, the primary bias of our technical analysis stays bearish.
Key Levels and Scenarios
Bullish scenario:
a confirmed 4H inverse head & shoulders breakout and daily market structure shift could trigger a corrective rally towards the prior daily high, representing a multi-percent recovery from current levels.
Critical levels to watch:
- ~2.05T – Daily low and major downside invalidation area
- ~2.18T – Monthly level / 4H demand zone and current reaction base
- ~2.23–2.25T – Short-term resistance and potential neckline region
- ~2.56T – Intermediate resistance before the range top
- ~2.65T – Daily high and main corrective target
Trading Implications
For active traders, any long exposure off the current Fib 100% retracement and 4H pattern should be sized conservatively, with clear invalidation below the daily low and partial profit-taking into each resistance step, as the move remains classified as corrective rather than a confirmed trend reversal.
This analysis is for informational purposes only and does not constitute financial advice.