


TOTAL Marketcap / Crypto Total Market Cap
TOTAL daily analysis 26-02-2026. TOTAL remains in a bearish context, but price action is pressing into a key decision area after an impulsive push that tagged the neckline of a potential reversal structure.
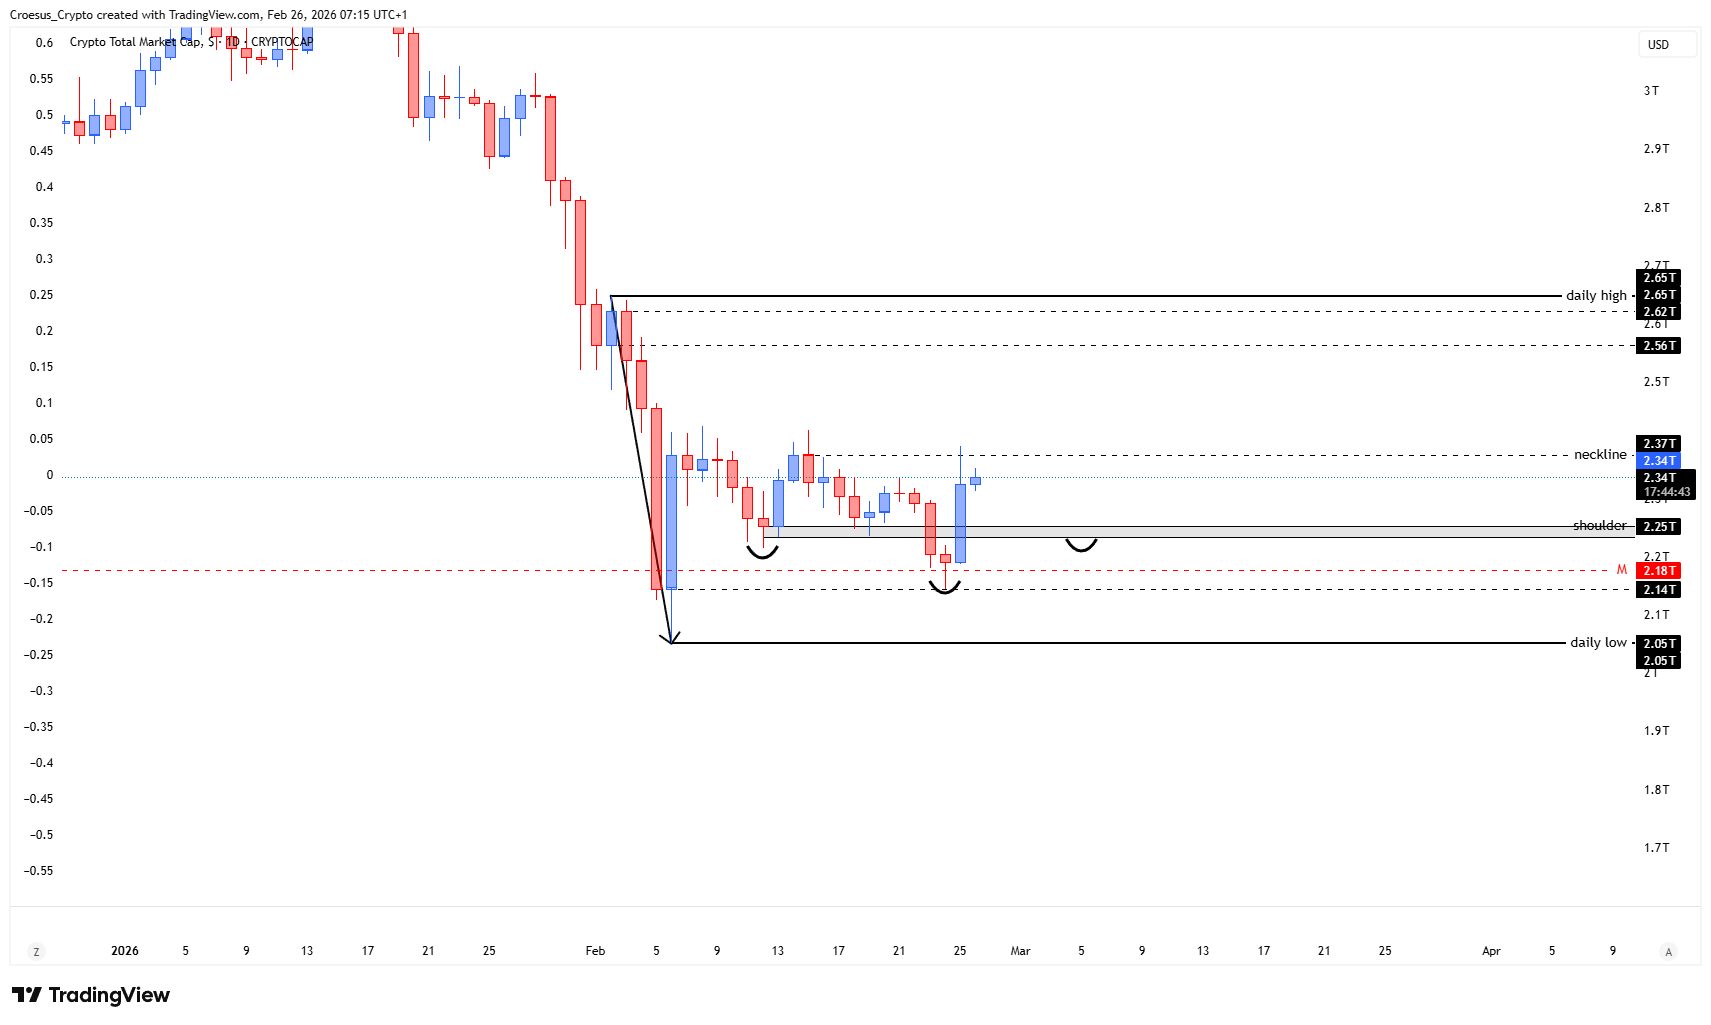
- As analysed the past couple of days, TOTAL has printed the B-level and yesterday made an impulsive move up until the neckline, as we would have liked to see.
- At this moment we can clearly see the formation of a reversal pattern : an inversed head and shoulder. The A-level acts as the neckline, the first retest acts as the shoulder line (gray zone), and the second retest as the head.
- With the impulsive move of yesterday, the neckline got tagged. This means we have two possibilities. Either we see some kind of bullish continuation possibly giving us an iHS with break of structure. Or we see a pullback towards the shoulder level, printing the right shoulder. Or even a pullback back towards the head giving us a double bottom. As soon as the index started going north, retail traders started going long with their stoploss just below the swing low. We still have a lot of empty space (liquidity) resting between the the first swing low @$2.05T and the most recent swing low @$2.14T
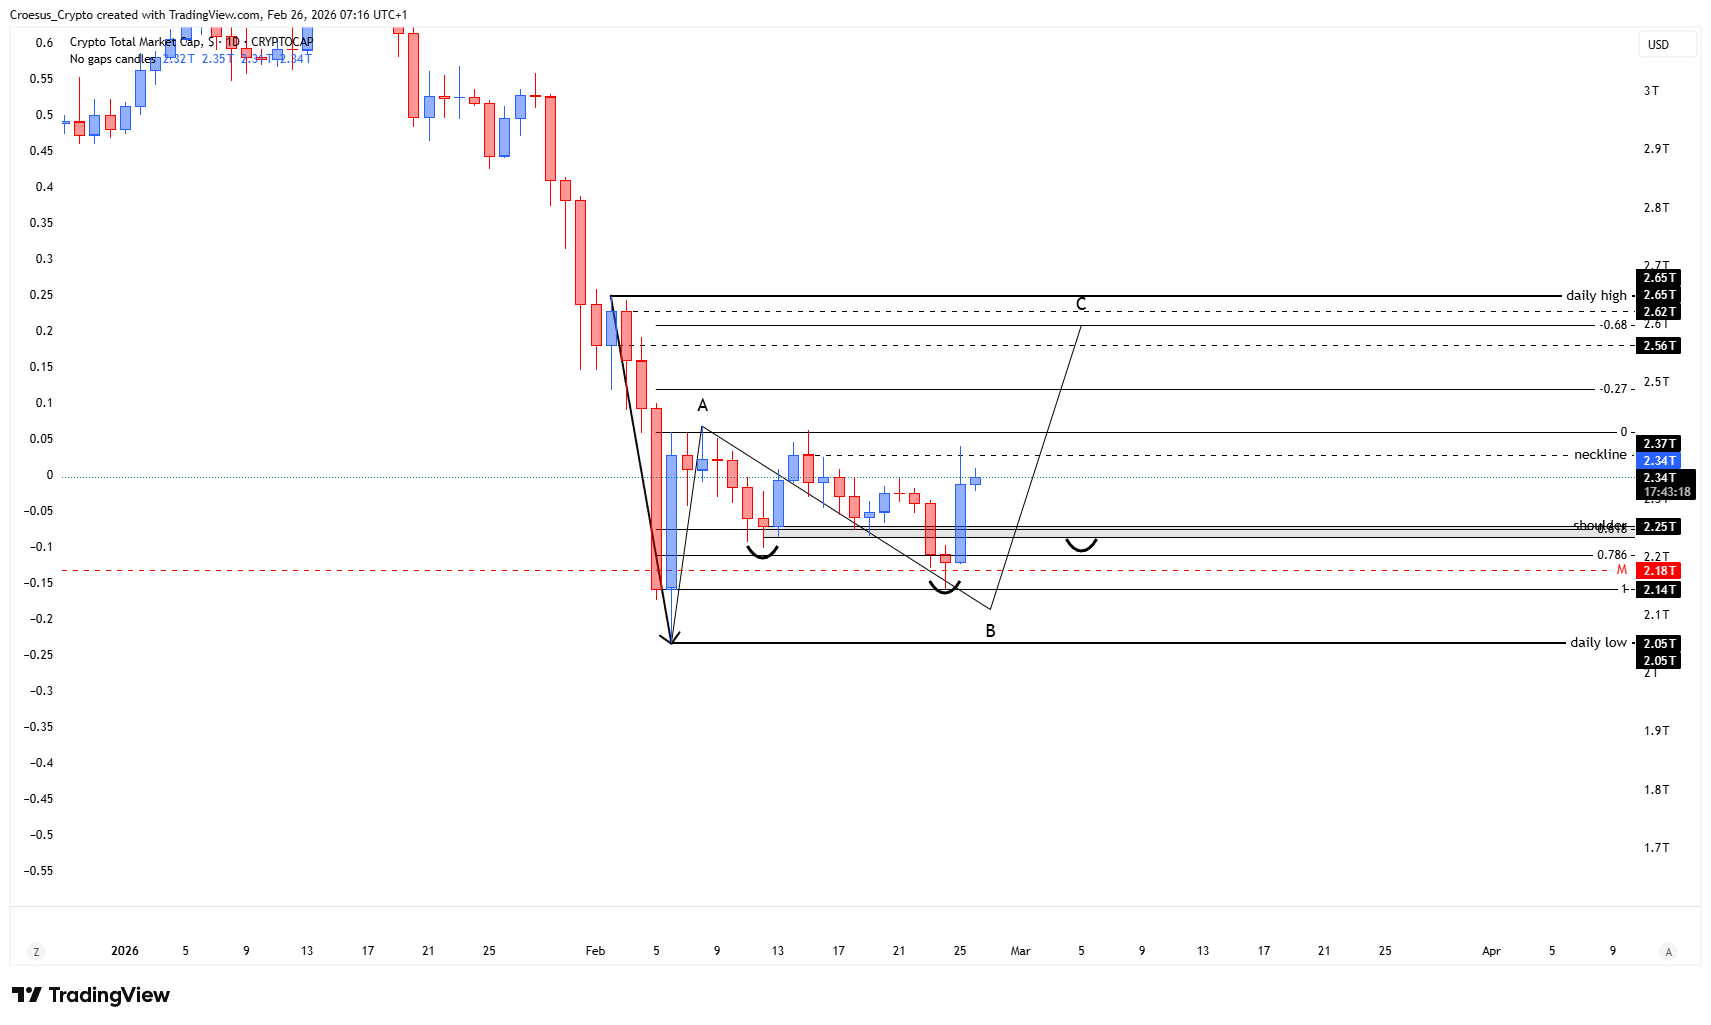
Market Structure Analysis
From a market structure perspective, our TOTAL daily analysis focuses on whether the impulsive move into the A-level (neckline) converts into a clean break of structure, or whether it is only a corrective push inside the broader bearish trend.
Our analysis maps an inverse head and shoulders: the first retest defines the shoulder line (gray zone), and the second retest defines the head. With the neckline now tagged, structure typically resolves in one of two ways: continuation through the neckline with follow-through (confirming buyers can defend higher lows), or a pullback into support to print the right shoulder.
The liquidity note is important: the space between the swing lows at $2.05T and $2.14T can act as a magnet if price retraces, especially if stops are clustered just below the swing low.
Key Levels and Scenarios
This TOTAL daily analysis remains conditional: bullish continuation needs acceptance above the neckline and a clear break of structure; otherwise, the more conservative expectation is a pullback into the shoulder/head region to rebalance liquidity before the next directional leg.
- A-level (neckline): the immediate decision level after being tagged by the impulsive move
- Shoulder line (gray zone): key support area to hold if a right shoulder forms
- $2.14T swing low: recent structural low and nearby liquidity reference
- $2.05T swing low: deeper downside liquidity reference and broader invalidation area for the higher-low attempt
Trading Implications
In a bearish environment, aggressive longs generally rely on fast confirmation (break of structure and acceptance above the neckline), while conservative participants often wait for the pullback and reaction at the shoulder line before reassessing. If price slips into the $2.14T–$2.05T liquidity pocket, volatility can expand quickly around those swing lows.
This analysis is for informational purposes only and does not constitute financial advice.