


This TOTAL daily analysis looks at the ongoing ABC correction within the broader bearish leg down. Our technical analysis follows Croesus Crypto’s naked-trading approach: clean price action, horizontal support resistance, and Fibonacci levels.
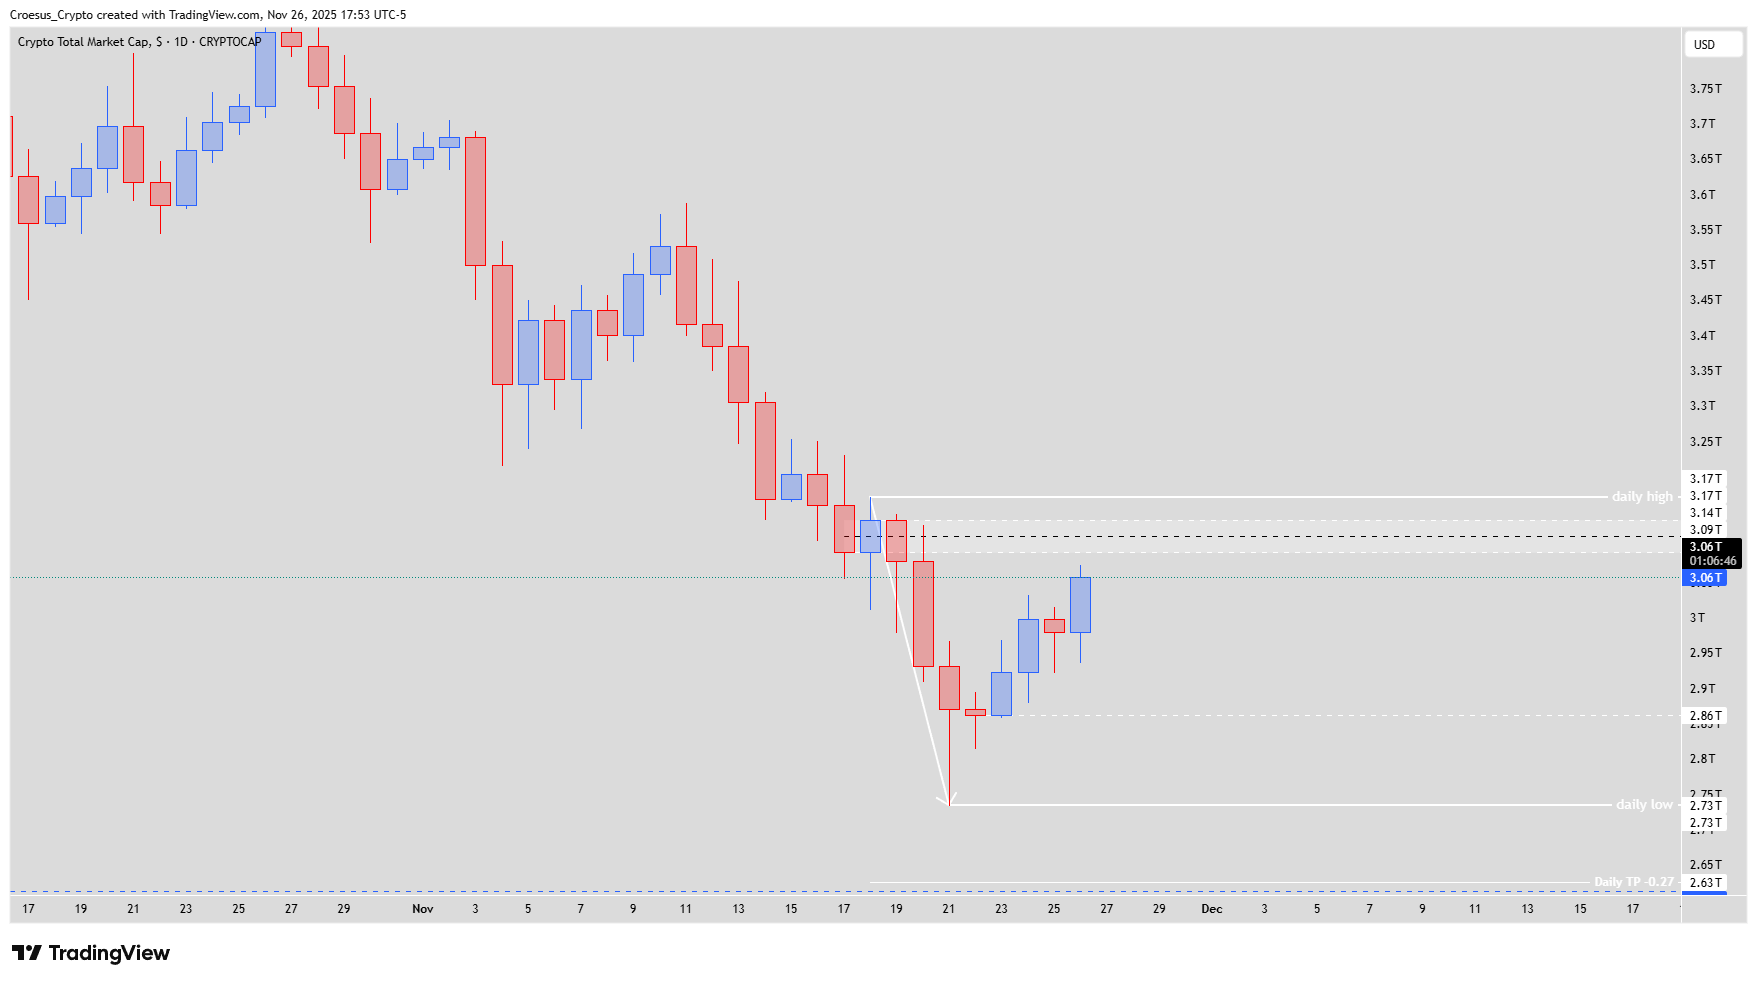
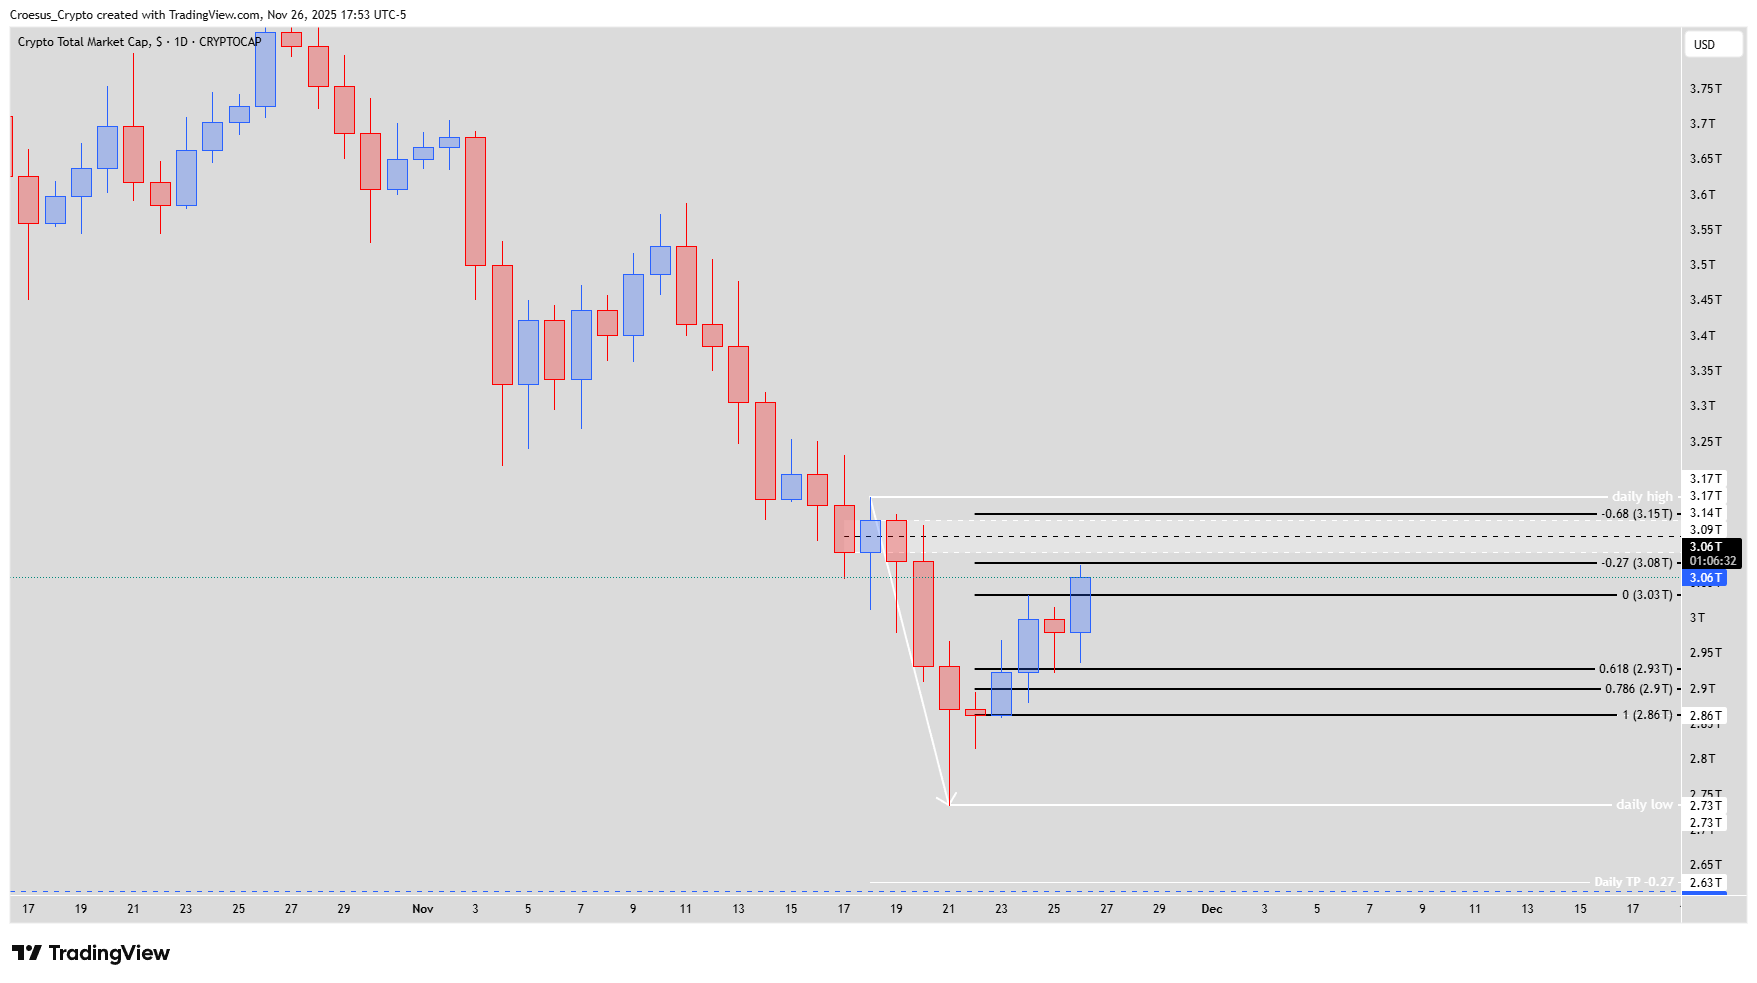
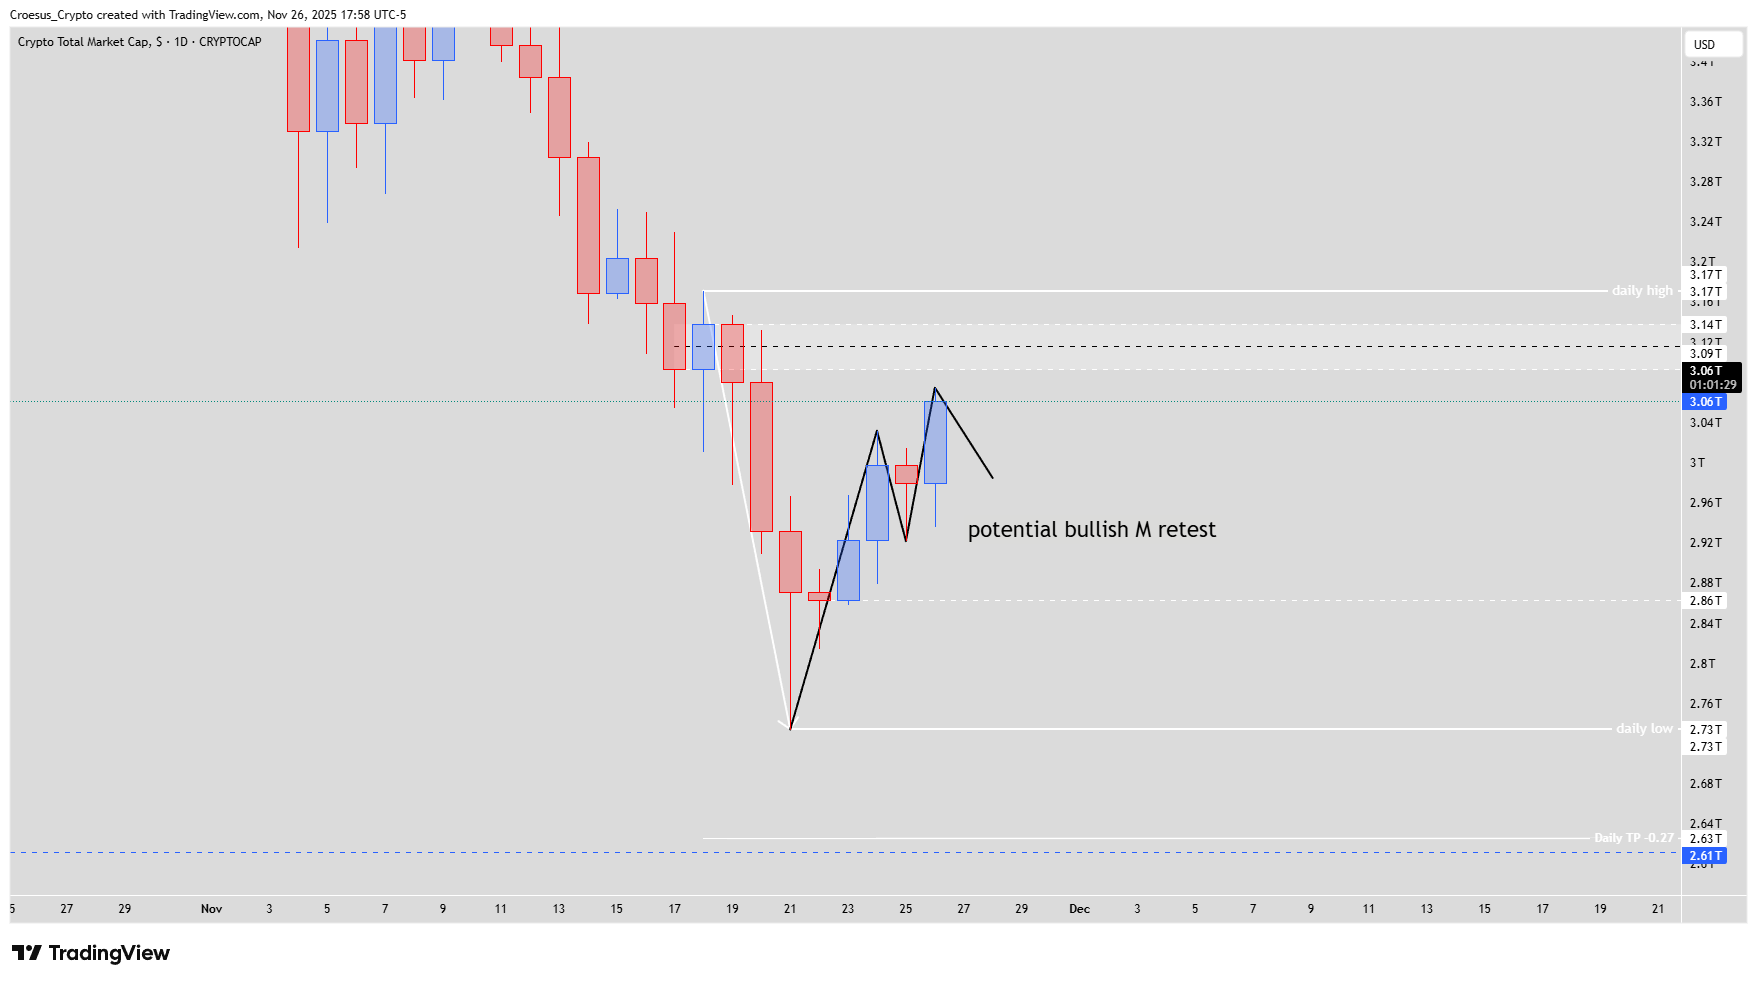
TOTAL daily chart 26 November 2025 showing ABC correction and potential bullish M retest between 3.09T and 3.17T resistance.
Trend = bearish
Technical Analysis Key Points
- As we expected we continue our ABC correction of the bearish leg down.
- The index touched the fib level 0.618 and then pushed up today nearly touching the -0.27.
- We could expect a retest of the bearish institutional candle completing a bullish M formation
- This would fit in our analysis that we expect a bullish relief rallye until 3T, but to initiate a bearish continuation or at least a retest of the lows.
- In order to get a bullish bias the index needs to break and close above the daily high @3.17T.
- At this moment our bias is still bearish : bullish correction until the first structure @ 3.09T followed by a bearish continuation to the 2.63 T. This level is confluent with the weekly shoulder level @ 2.61T.
Market Structure Analysis
In this TOTAL daily analysis, the market is printing an ABC corrective structure after a strong impulsive selloff. Price respected the 0.618 Fibonacci retracement of the bearish leg and reacted higher toward the -0.27 extension, underlining that sellers are still defending the upper part of this corrective range. The potential retest of the bearish institutional candle to complete a “bullish M” would fit a classic corrective pattern before continuation. As long as the index trades below the daily high at 3.17T, our bias remains a bearish continuation after a temporary relief rally.
Key Levels and Scenarios
Bullish scenario: a clean break and daily close above 3.17T would invalidate immediate bearish continuation and open space for a larger recovery leg, with upside extension beyond 3T and a possible trend shift in later TOTAL daily analysis.
Key levels to watch:
3.17T – daily high; break/close above needed for sustained bullish bias.
3.09T – first structure / resistance zone for the bullish correction.
3.00T–3.02T – psychological area around 3T for short-term relief-rally targets.
2.63T – main downside target for bearish continuation.
2.61T – weekly shoulder level confluent with 2.63T, major higher-timeframe support.
Trading Implications
From a risk/reward perspective, this technical analysis favors patience: aggressive traders may look for bearish setups in the 3.00T–3.09T zone while keeping tight invalidation above 3.17T, and position sizing should reflect the volatility of the total crypto market cap.
This content is for educational purposes only and is not financial advice; always do your own research before making any investment or trading decisions.