TOTAL Marketcap / Crypto Total Market Cap
TOTAL daily analysis 26/03/2026. The total crypto market cap index is currently rejecting from a prior high and rotating back into the range, with price now reacting around the daily equilibrium zone where directional conviction typically gets decided.
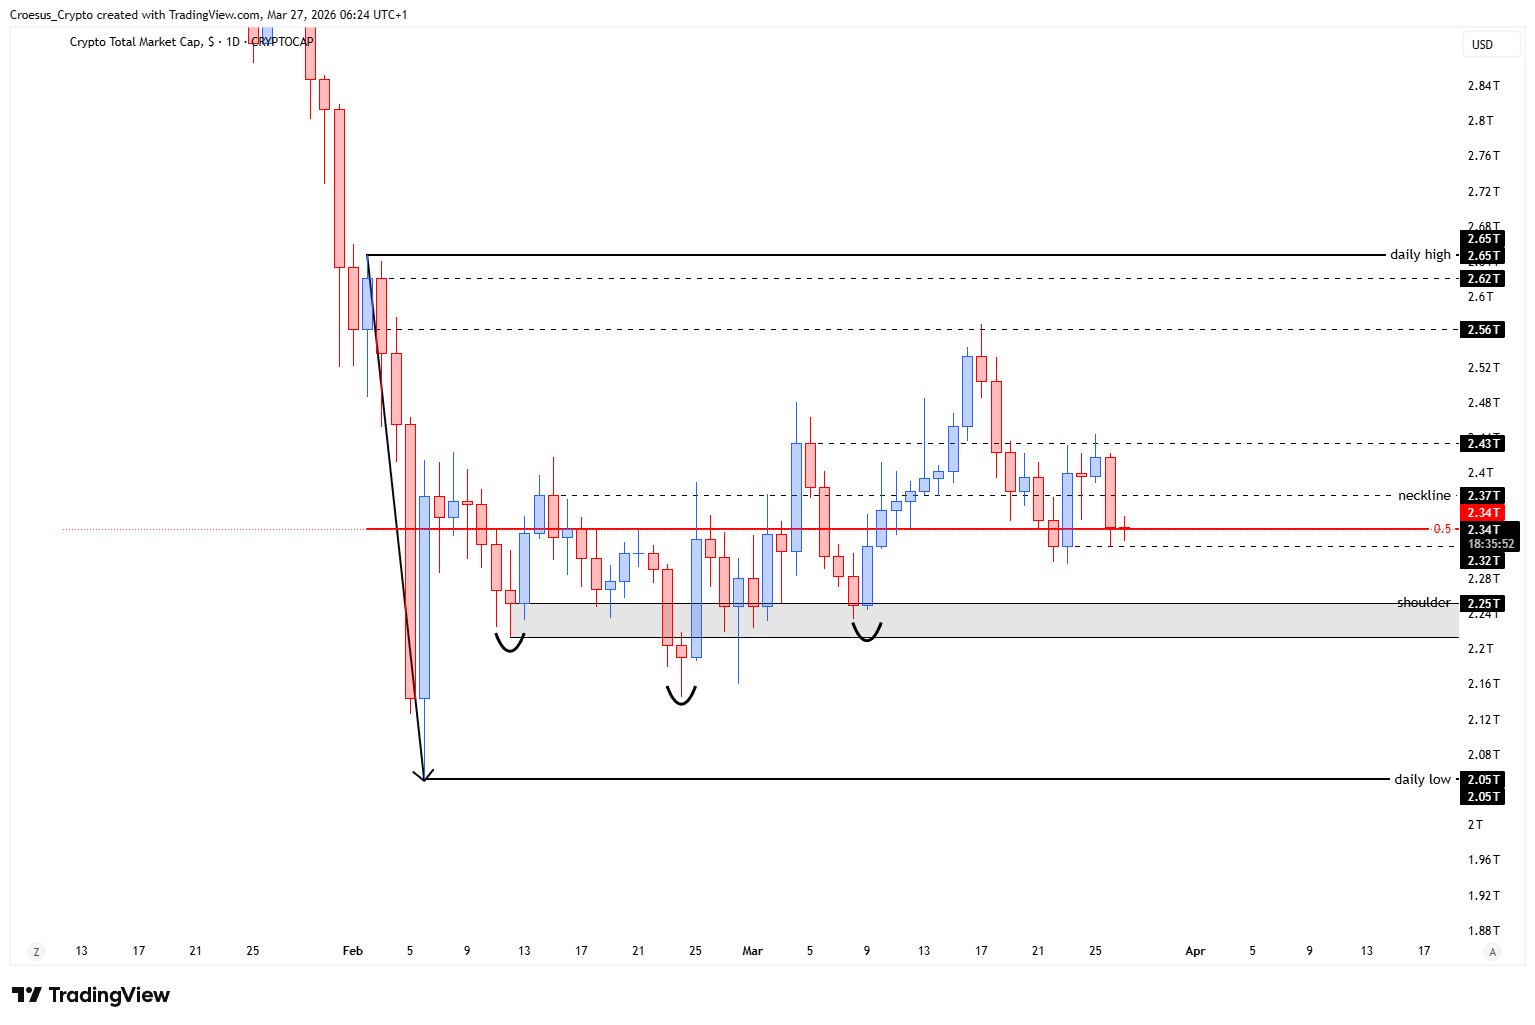
- The index shows a bearish rejection at the prior high, falling back towards the prior low and testing the 50% level (equilibrium) of the daily range.
- If the index is not able to hold the 50% level of the daily range, it is going back from a bullish towards a bearish sentiment within the range.
- Within the bigger picture we are still bearish, on the weekly as well as on the daily. Bulls are not convincing at this moment.
Market Structure Analysis
From a naked trading perspective, the key takeaway in this TOTAL daily analysis is the rejection at the prior high: price attempted to push into the upper boundary, failed, and rotated lower back toward the range mid. The 50% level (equilibrium) acts as the “decision line” for the current daily range—holding above it keeps the move classified as a rotation within the range, while losing it increases the probability of continuation toward the prior low. With the bigger picture described as bearish on both the weekly and daily, any bounce from equilibrium needs to show clean impulsive follow-through to shift structure; otherwise, upside attempts remain corrective and vulnerable to sell pressure from prior resistance.
Key Levels and Scenarios
In the near term, our TOTAL daily analysis stays range-focused. The market is effectively negotiating whether this is a routine pullback (holding equilibrium) or a sentiment shift back to the downside (accepting below equilibrium).
- Prior high — key resistance where the bearish rejection occurred
- 50% level (equilibrium) of the daily range — pivotal support resistance “decision” zone
- Prior low — downside magnet if price loses and accepts below equilibrium
Trading Implications
Aggressive traders typically treat the 50% level as the line in the sand: acceptance above supports range rotation trades, while acceptance below aligns with the broader bearish context and favors downside continuation setups. Conservative traders generally wait for clear acceptance (and follow-through) either back above equilibrium or toward the prior low before increasing exposure, given that bulls are “not convincing” in the current structure.
This analysis is for informational purposes only and does not constitute financial advice.