


TOTAL Marketcap / Crypto Total Market Cap
TOTAL daily analysis 26/05/2026. The total crypto market cap is trading with a bearish tone after a failed push above the daily high, and our technical analysis focuses on whether the current weekly support can hold to trigger a short-term mean reversion.
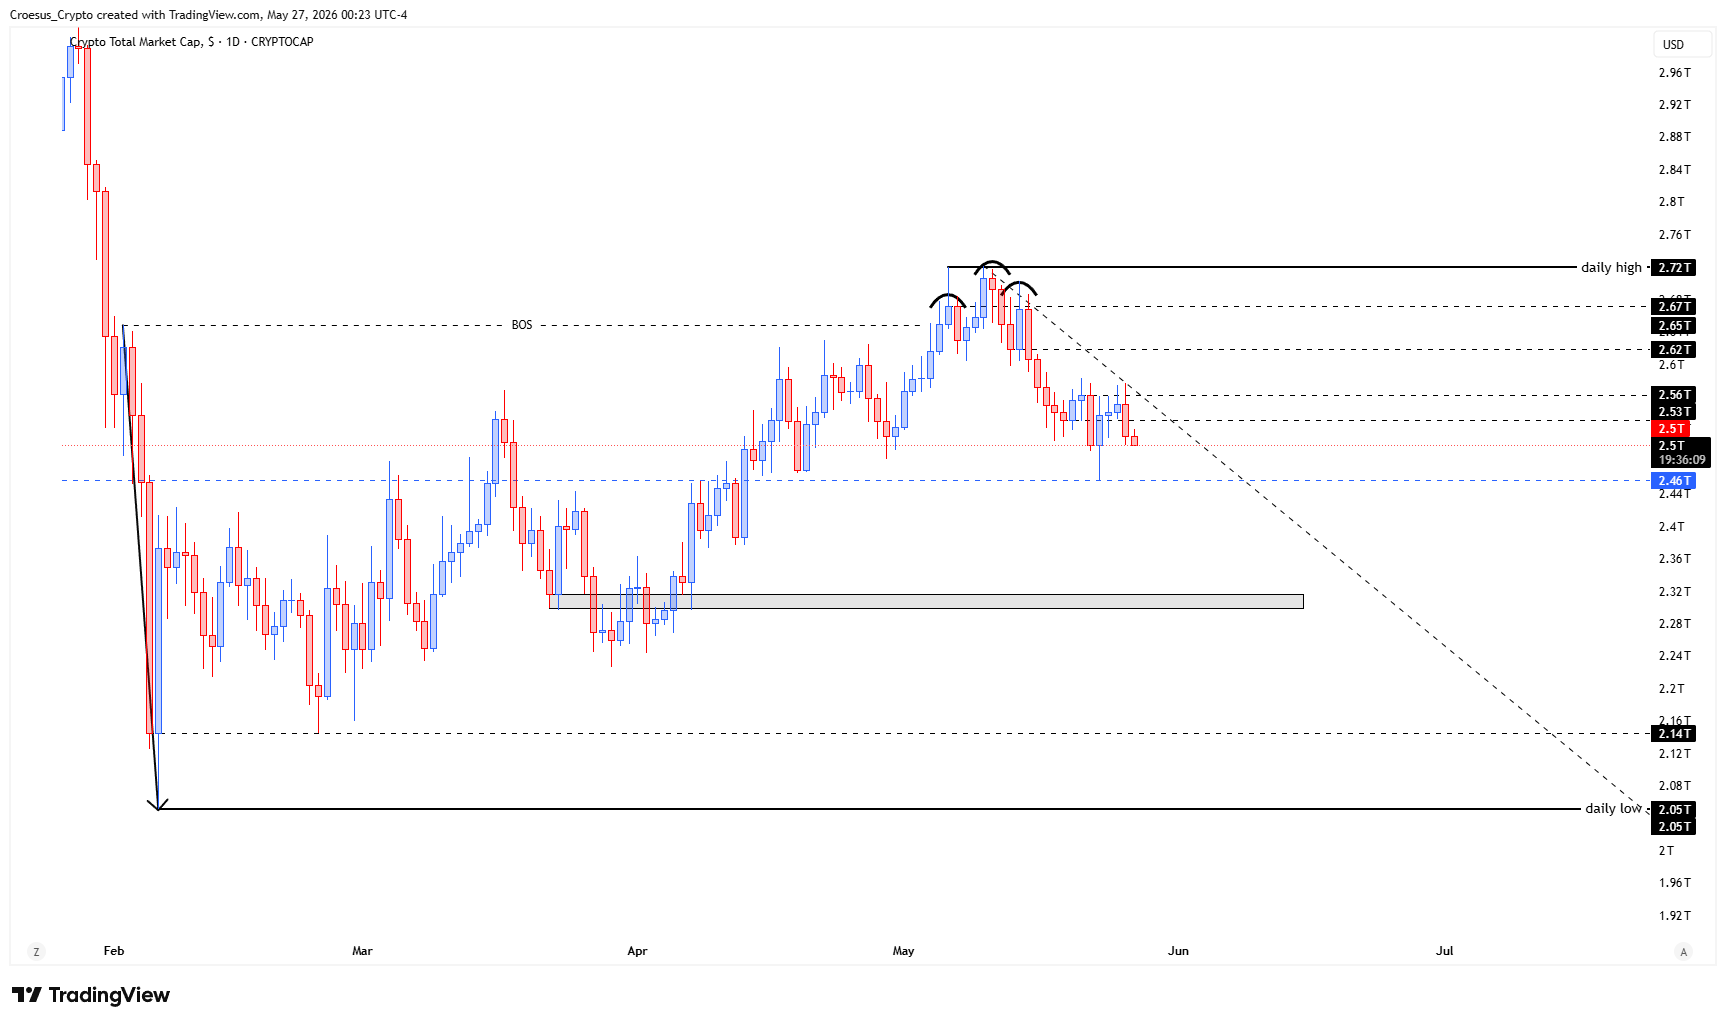
- After breaking the daily high, TOTAL showed us a reversal pattern (head and shoulders).
- After this reversal move, the index fell down towards a weekly key level @ 2.46T without retesting the prior levels @ 2.62T. This weekly level could offer some support in order to retest this level. This is why we looking @ this pattern as a local reversal pattern (inv H&S with double bottom).
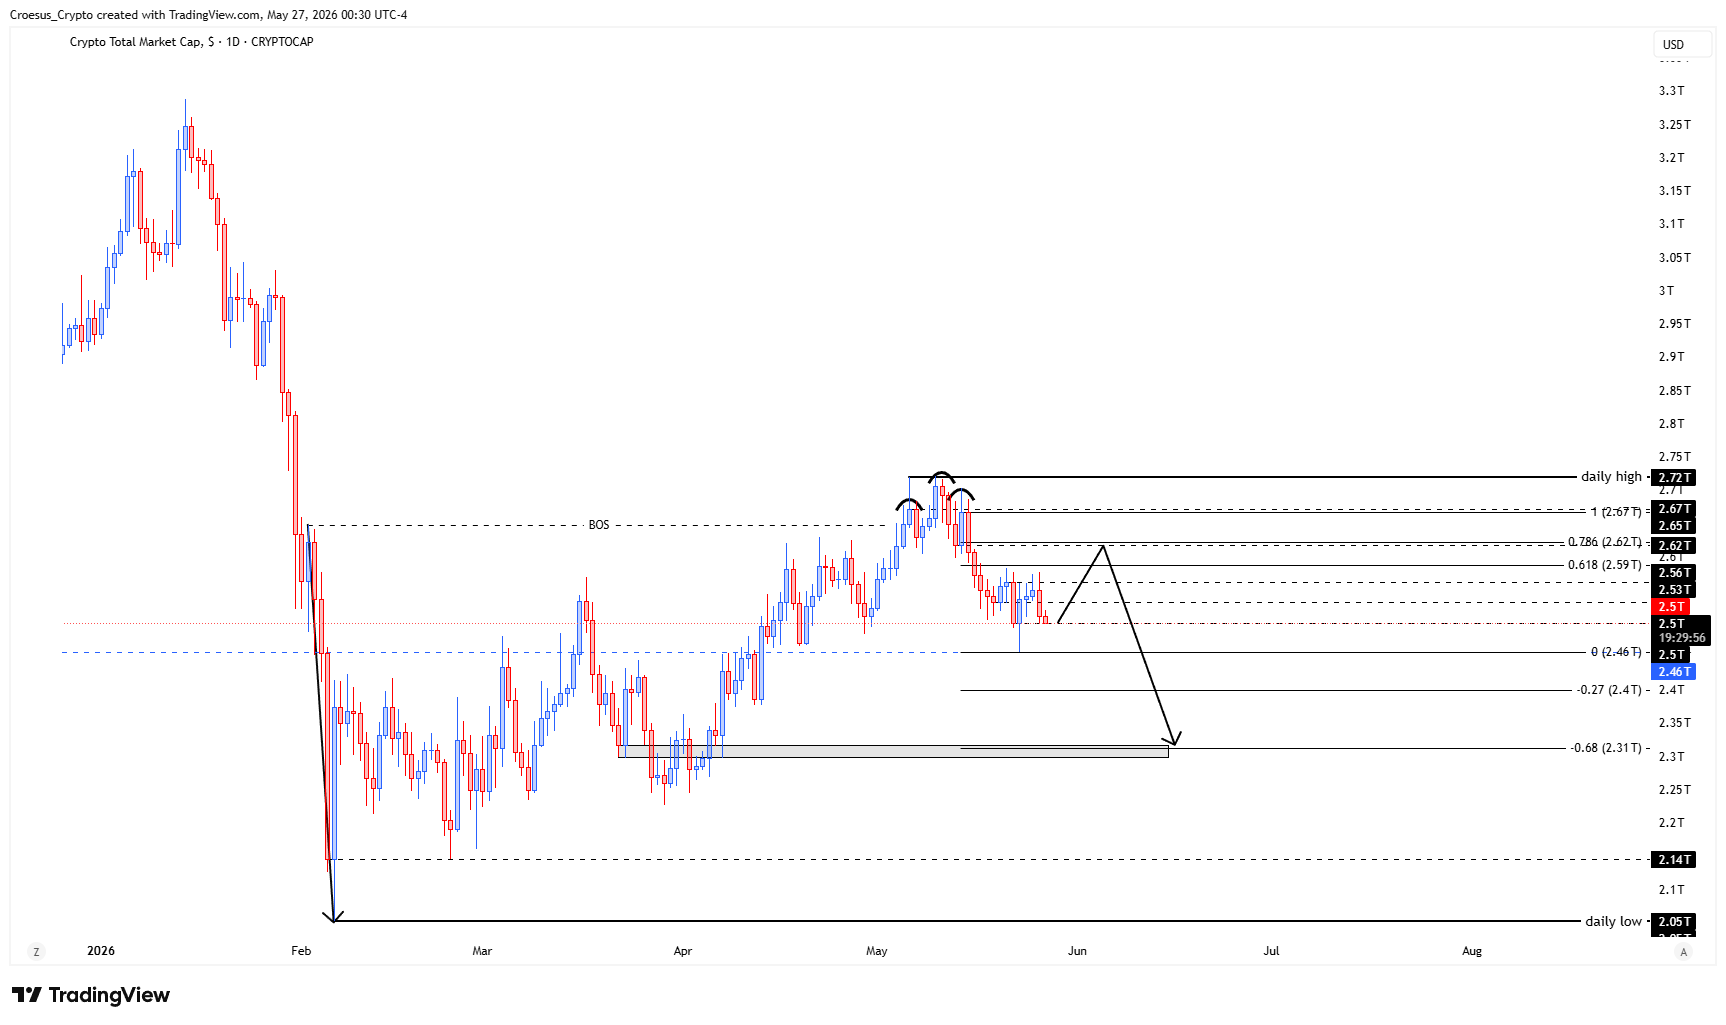
Market Structure Analysis
From a market structure perspective, the move above the daily high followed by a head and shoulders reversal signals a liquidity grab and a failed breakout, often preceding an impulsive move lower. Price then rotates directly into a higher-timeframe (weekly) decision zone around 2.46T, which becomes immediate support resistance context for any rebound.
The fact that the drop did not retest the prior area around 2.62T highlights an unfilled zone overhead; structurally, that can act as a magnet on any corrective bounce before continuation. In this context, our TOTAL daily analysis treats the “inv H&S with double bottom” as a local reversal attempt inside a broader bearish leg: it only becomes meaningful if buyers defend the weekly low area and reclaim structure back toward prior levels.
Key Levels and Scenarios
Bearish continuation remains the base case unless the market can hold the weekly level and build a clearer corrective structure upward. A sustained acceptance below weekly support keeps downside pressure in control, while a reaction from support increases the odds of a retest toward the prior level zone, where supply may return.
- 2.46T (weekly key level): primary support; losing it keeps the bearish impulse intact
- 2.62T (prior level): first meaningful retest zone if price bounces from support
- Daily high / head and shoulders failure zone: overhead resistance area tied to the reversal trigger
Trading Implications
In this TOTAL daily analysis, the current area is a classic inflection point: aggressive participants may focus on short-term reactions off weekly support, while conservative participants typically wait for a clearer break of structure and confirmation around support resistance before positioning.
This analysis is for informational purposes only and does not constitute financial advice.