


Our TOTAL daily analysis for late November 2025 focuses on the developing ABC correction into key Fibonacci and support resistance zones after the sharp November selloff, using our naked trading, structure-first methodology.
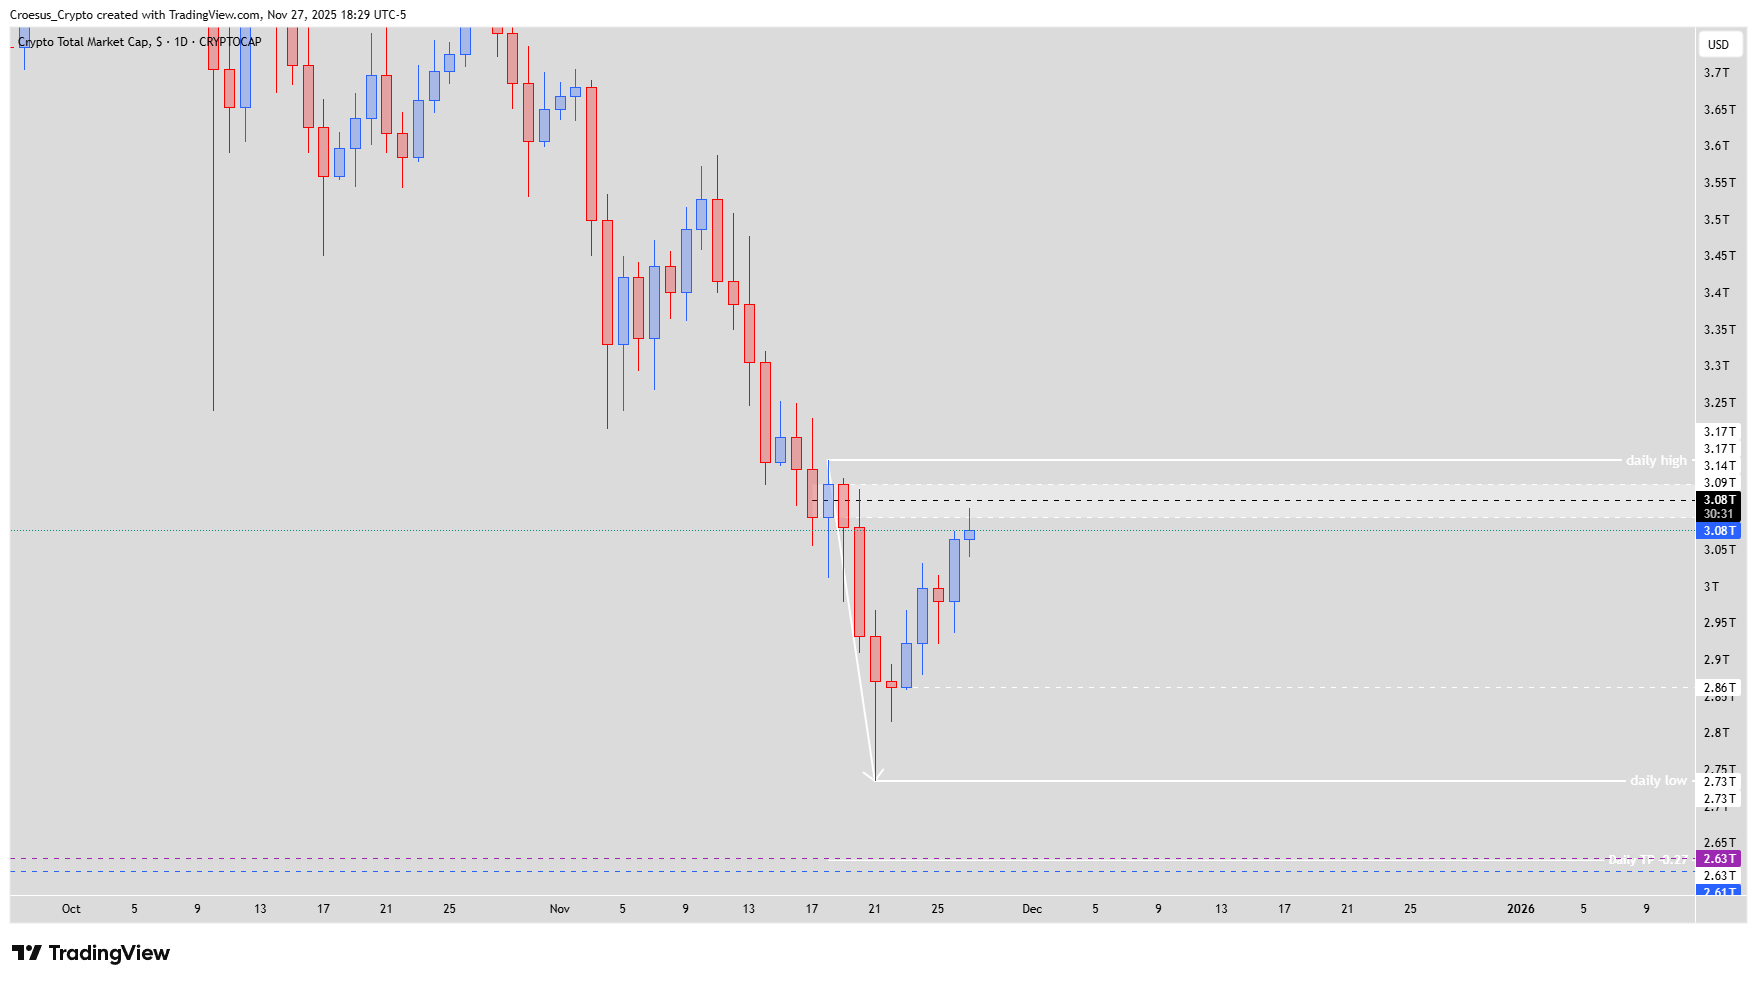
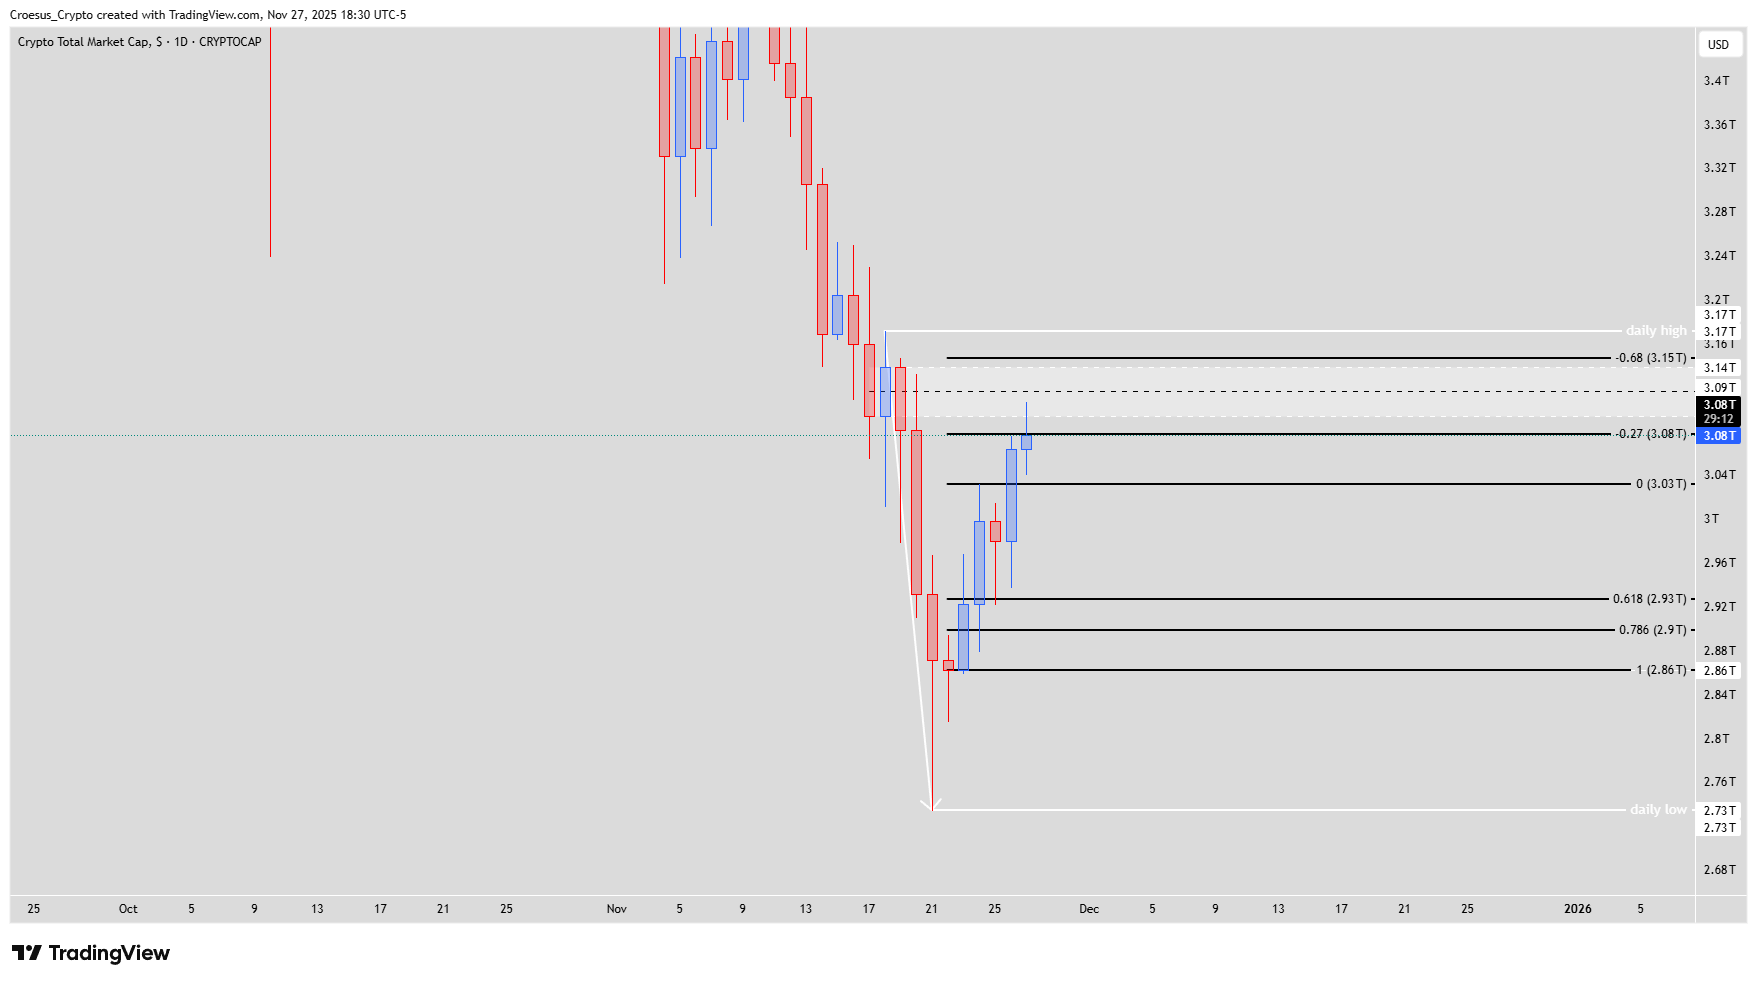
TOTAL daily chart 27 Nov 2025 with Fibonacci -0.27/-0.68 levels, daily entry zone and ABC correction.
Trend = bearish
Technical Analysis Key Points
- Where yesterday the index just didn't touch the fib level -0.27, today it touched the level and also the daily entry zone.
- We can look on the lower timeframe 4H for an entry pattern, but we still have to be cautious. If the ABC correction plays out completely, it will want to touch also the -0.68.
- In order to get a bullish bias the index needs to break and close above the daily high @3.17T.
- At this moment our bias is still bearish : bullish correction until the first structure @ 3.09T followed by a bearish continuation to the 2.63 T. This level is confluent with the weekly shoulder level @ 2.61T.
Market Structure Analysis
From a market-structure perspective, this TOTAL daily analysis frames current price action as a corrective bounce inside a broader downtrend. The index has finally tagged the -0.27 Fibonacci level and daily entry zone, confirming this area as the first meaningful resistance after the capitulation wick. If the ABC structure extends toward the -0.68 Fibonacci, we would still treat this as a corrective leg unless bulls can force a daily close above 3.17T. Until that break, the path of least resistance remains to the downside, with 3.09T acting as the first ceiling before potential continuation toward the 2.63T–2.61T confluence zone.
Key Levels and Scenarios
Bullish scenario: buyers must first defend above the current corrective low and then secure a decisive daily close over 3.17T, opening room for a larger retrace beyond the current ABC structure.
Key levels to watch:
3.17T – daily high; close above shifts bias to bullish.
3.09T – first structure / corrective resistance in this technical analysis.
-0.27 Fibonacci – already tested; initial reaction zone.
-0.68 Fibonacci – potential completion point of the ABC correction if extension continues.
2.63T–2.61T – main bearish continuation target and weekly shoulder confluence support.
Trading Implications
For trade planning, we prefer waiting for clear 4H reversal patterns around 3.09T or the -0.68 level, using tight invalidation above 3.17T and sizing positions conservatively relative to overall portfolio risk.
This content is for educational purposes only and is not financial advice; always do your own research before making any investment or trading decisions.