


TOTAL Marketcap / Crypto Total Market Cap
TOTAL daily analysis 27/05/2026. TOTAL remains under pressure as the market fails to sustain the latest relief attempt and continues to rotate back into weaker territory within the broader weekly range.
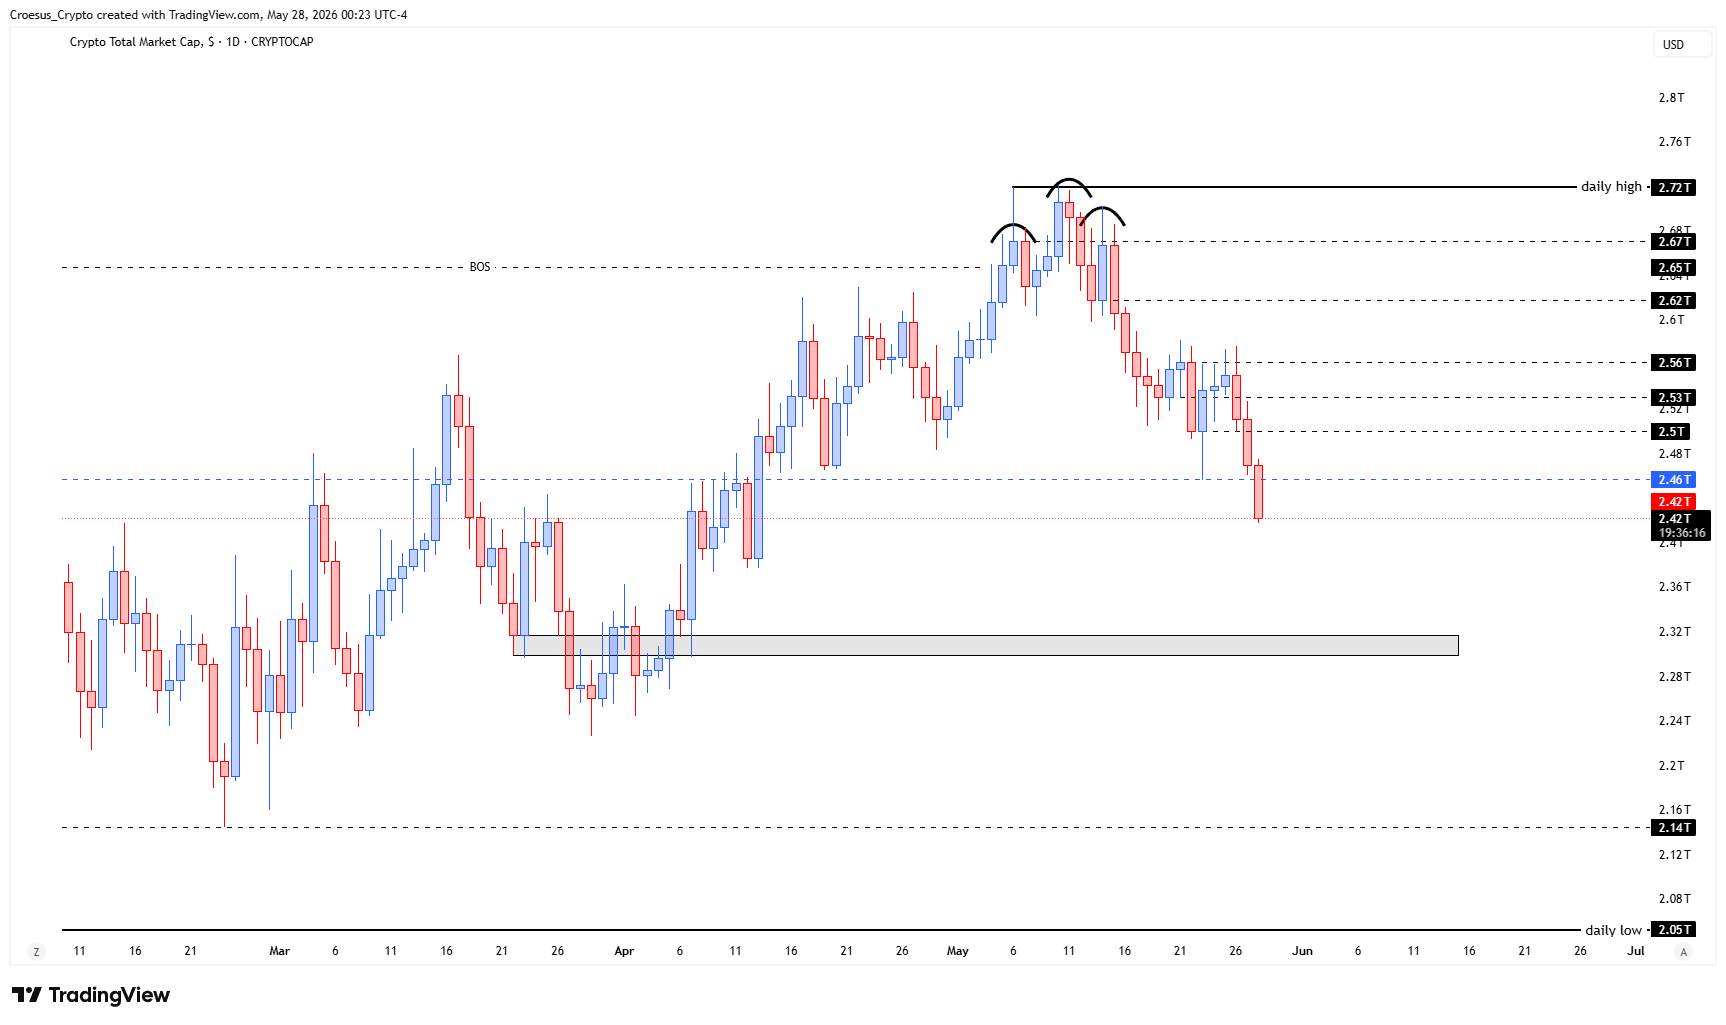
- TOTAL continues to drop, after a failed relief.
- TOTAL printed a natural bearish W (equal lows, equal highs) before the further decline.
- This could still fit in a larger weekly corrective move, but this a time to be cautious : we are back in the lower half of the weekly range (weaker performance).
Market Structure Analysis
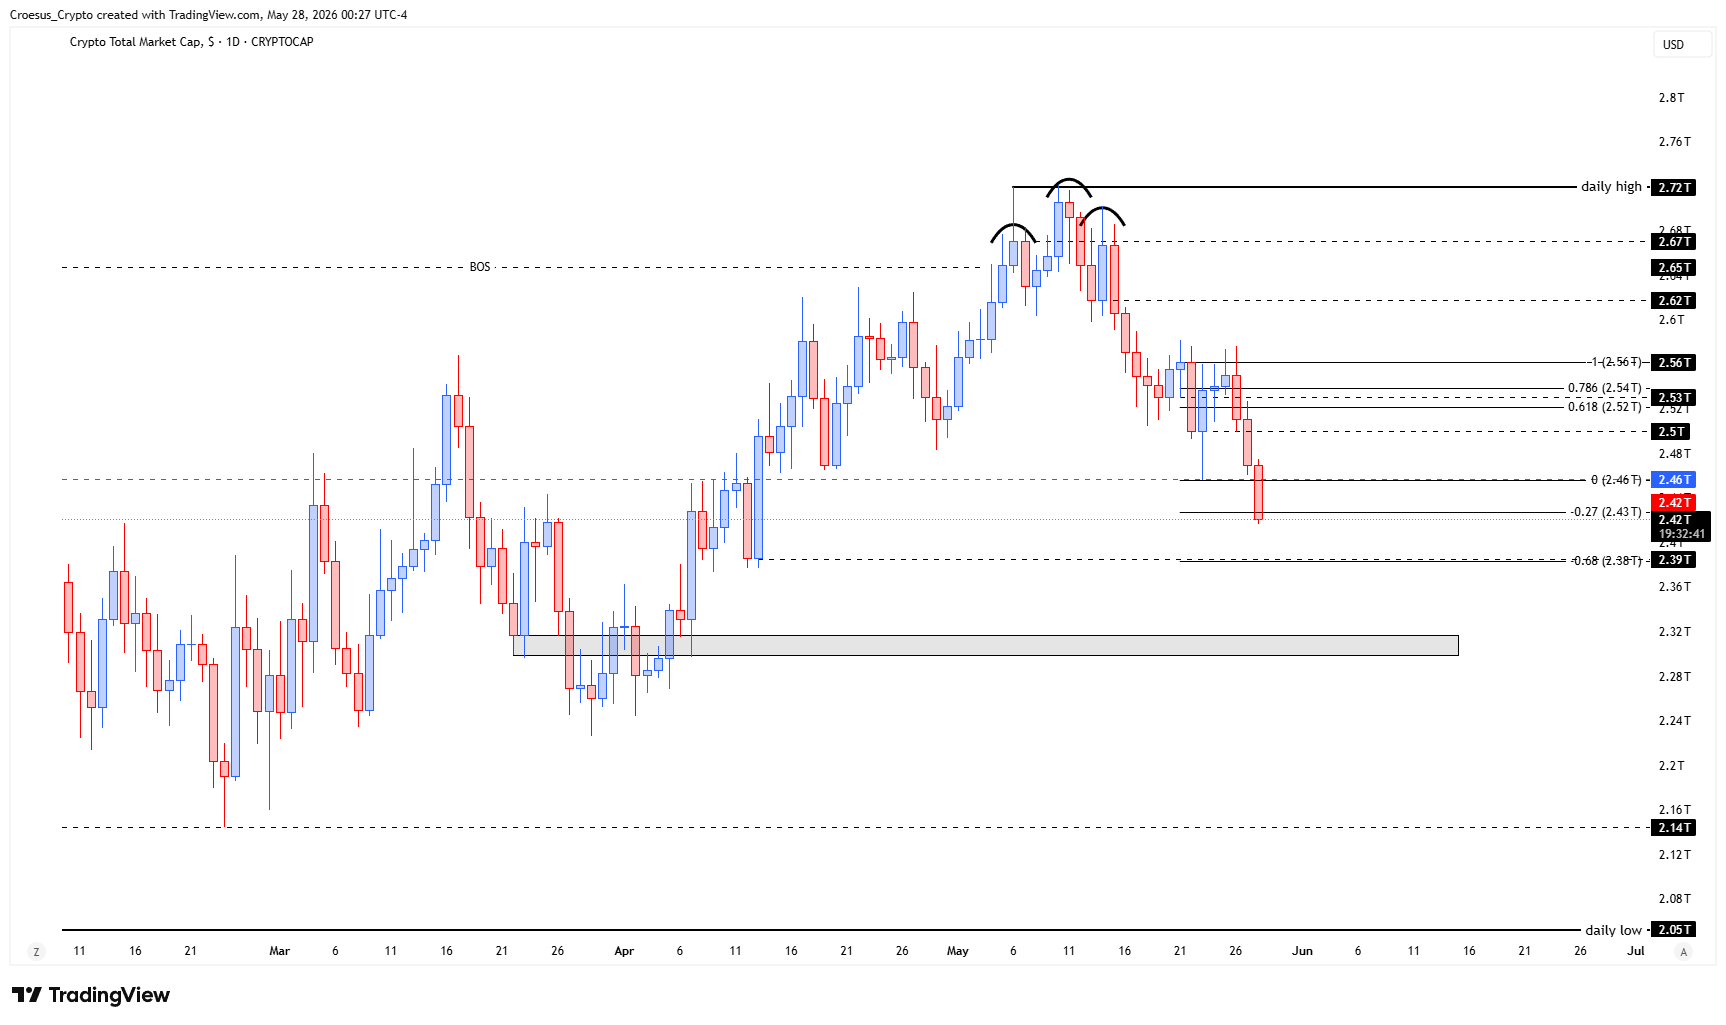
From a market structure perspective, the “failed relief” signals that the prior bounce lacked follow-through and likely acted as a corrective leg rather than the start of a clean impulsive recovery. The “natural bearish W (equal lows, equal highs)” highlights a balanced structure where price repeatedly tests liquidity on both sides before resolving lower, which often aligns with distribution and a continuation move into downside targets. With TOTAL now trading back in the lower half of the weekly range, our analysis treats the range midpoint as an important support resistance pivot: acceptance below it typically keeps sellers in control, while reclaiming it is needed to shift conditions back toward neutrality. This also supports the idea that the current selloff can still be part of a larger weekly corrective move, but the location within the range keeps the risk skewed to the downside until structure improves.
Key Levels and Scenarios
In this TOTAL weekly analysis, the bearish scenario remains active while price holds below the range midpoint and continues printing lower highs into rebounds. A more constructive scenario requires a clean reclaim back into the upper half of the weekly range, showing buyers can convert prior resistance into support.
- Weekly range midpoint as the key pivot (regain = stabilisation, reject = continuation risk)
- Equal lows from the bearish W as the next structural support area to defend
- Equal highs from the bearish W as the overhead resistance zone that capped the relief attempt
- Lower half of the weekly range as the current “weak performance” area where downside extensions are more likely
Trading Implications
With TOTAL positioned in the lower half of the range, aggressive participants typically look for confirmation (break of structure or clear reclaim) rather than anticipating a bottom, while conservative participants often wait for the market to prove strength by recovering key pivots. Until that shift happens, downside continuation remains the higher-probability path.
This analysis is for informational purposes only and does not constitute financial advice.