


TOTAL Marketcap / Crypto Total Market Cap
TOTAL daily analysis 28 January 2026. The total crypto market cap index is currently rejecting from a known daily entry zone, and our read remains skewed to the downside as sellers defend overhead supply and structure starts to roll over.
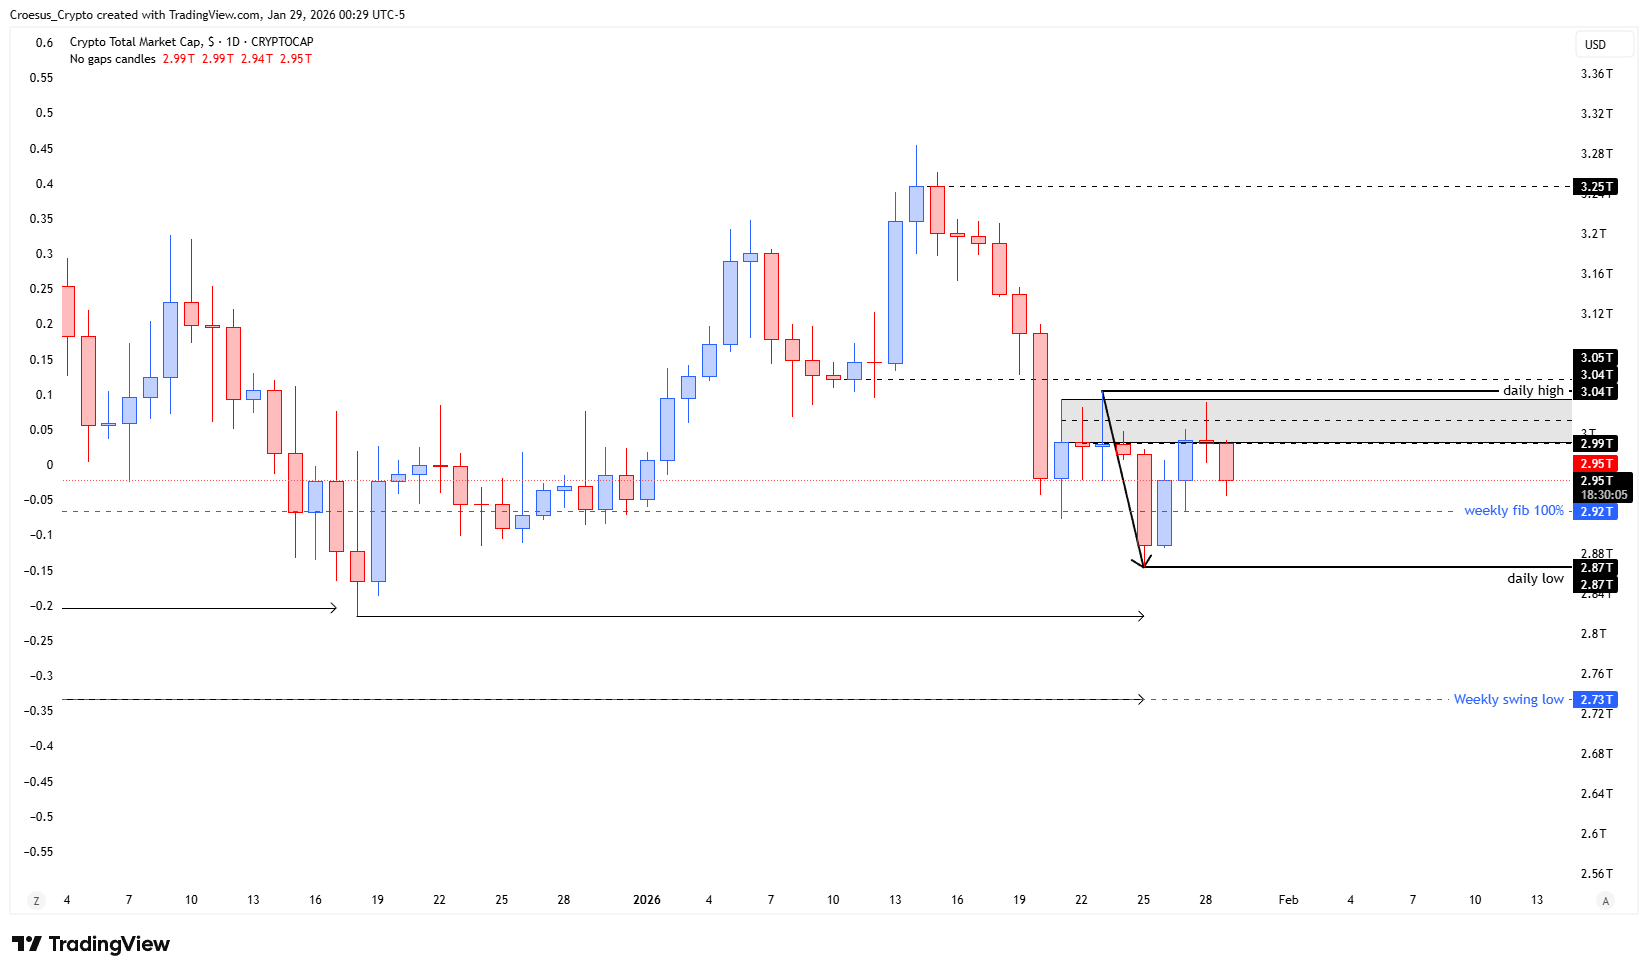
- The index shows us a clear rejection on the daily entry zone.
- Our bearish set-up, the bearish W is starting to play out.
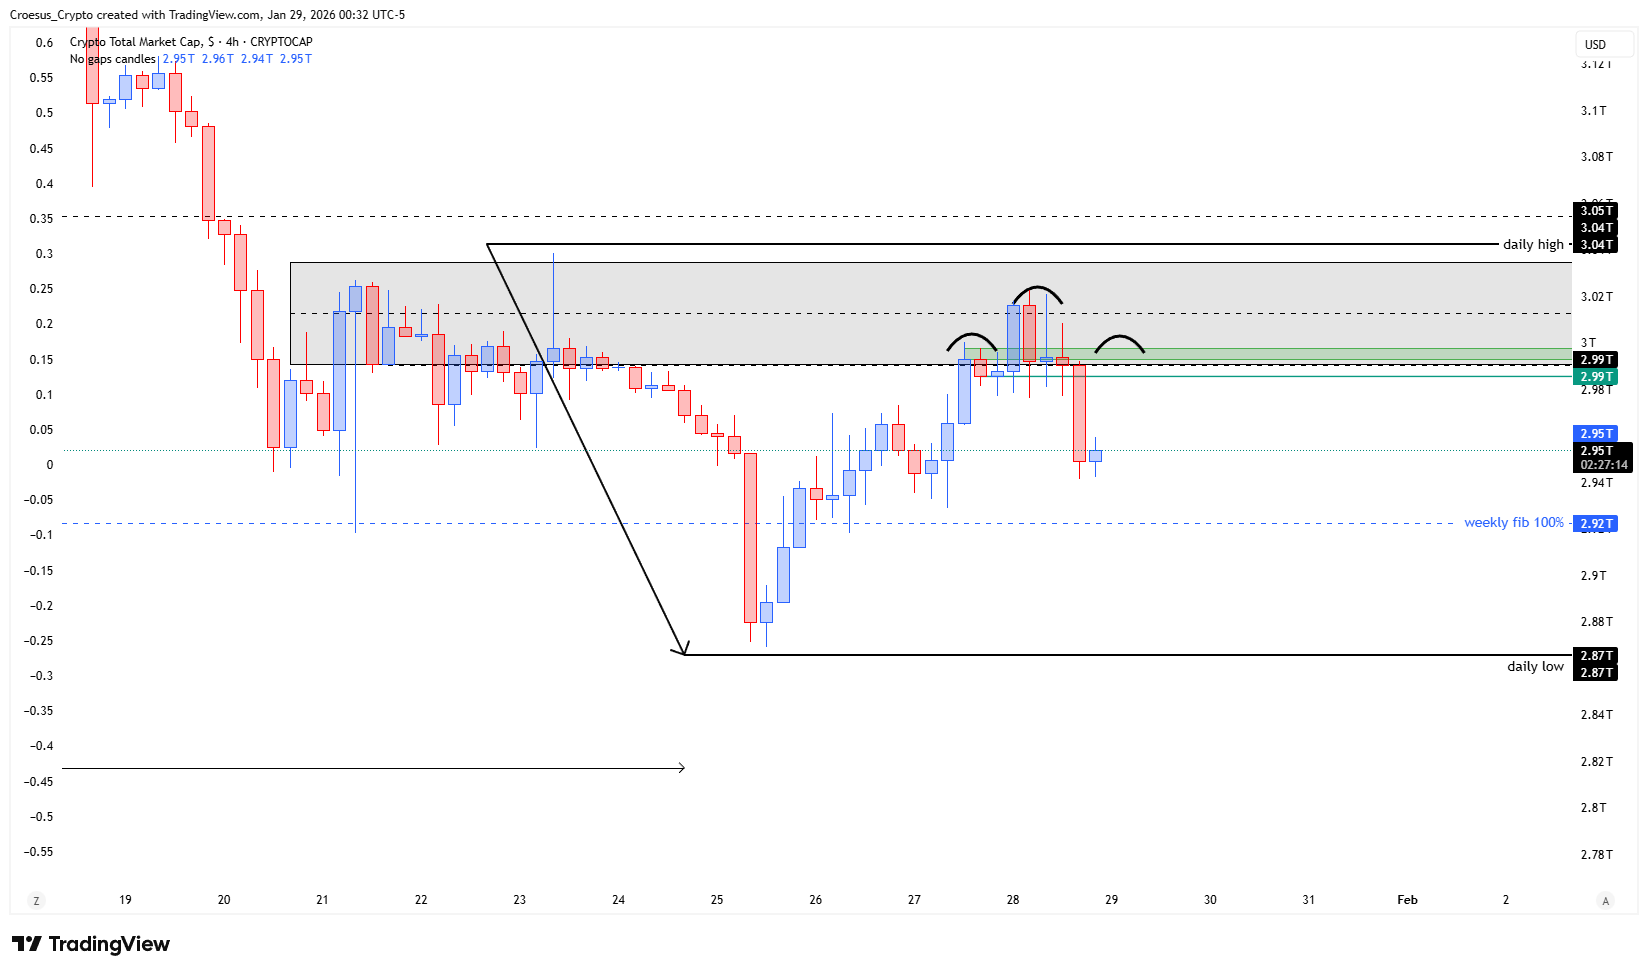
- After hitting the daily entry zone, we zoom in on the 4H timeframe. Here we look for an entry pattern.
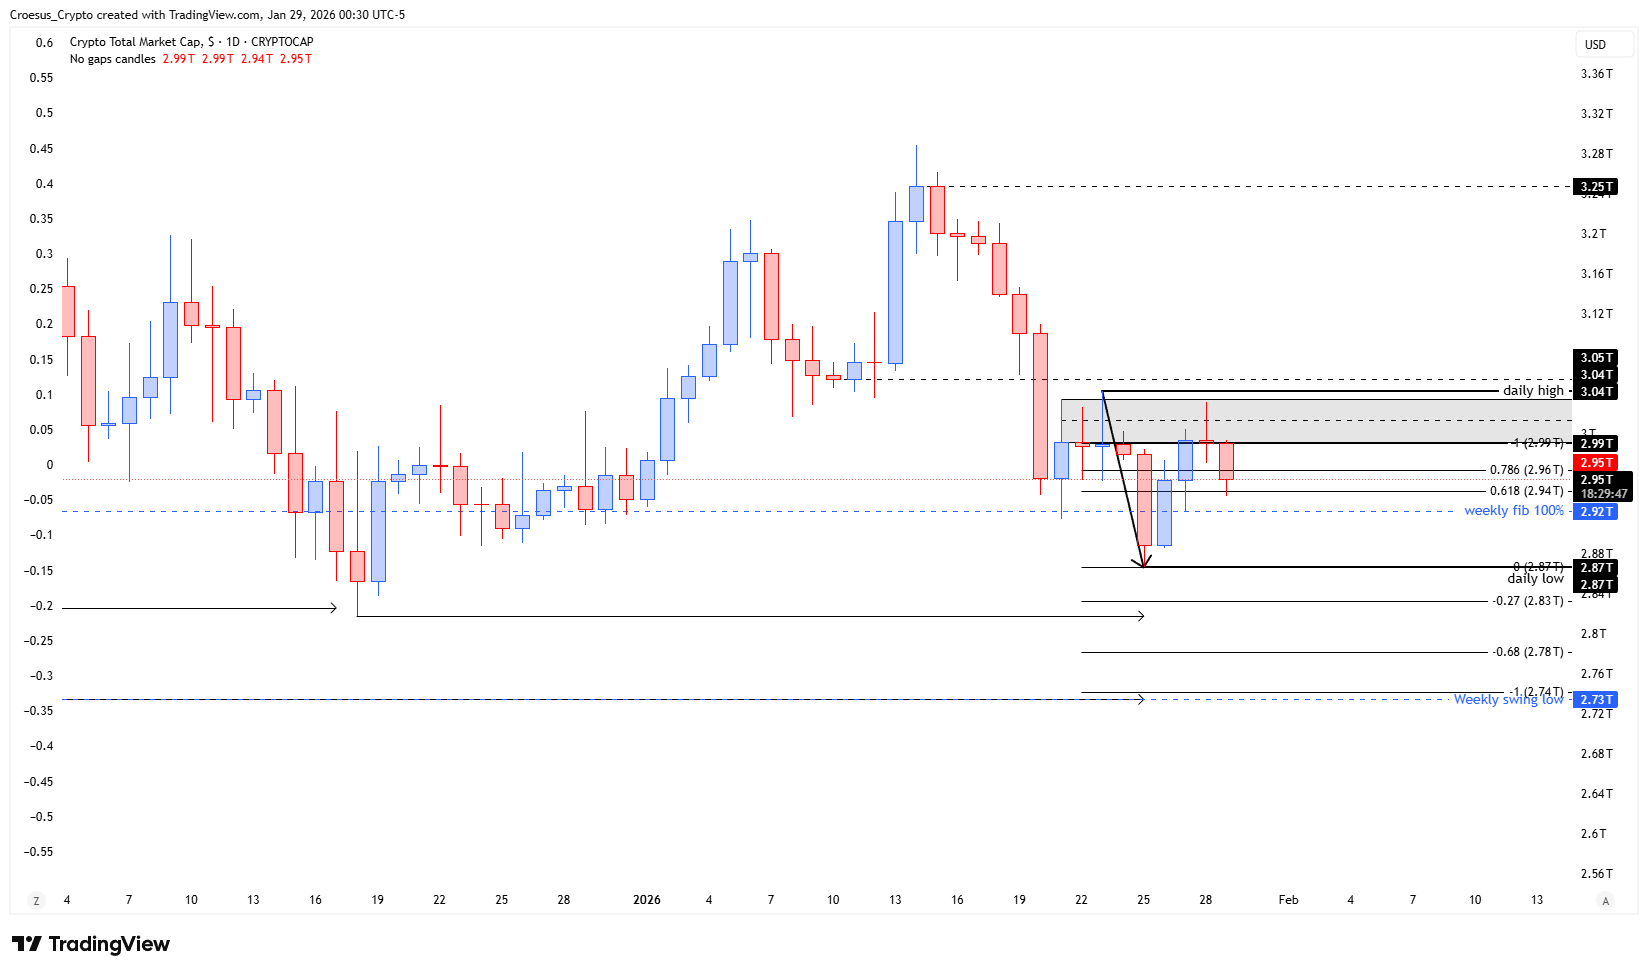
- We can clearly see a head and shoulders pattern with a clear break of structure which confirms the bears are kicking in. Possible short entry on the shoulder. Stoploss above the shoulderlevel (as we have a break of structure)(above the head if you want to be more conservative and are willing to give up some RR). Take profit on daily fib -0.27.
Market Structure Analysis
In this TOTAL daily analysis, the key takeaway is the rejection at the daily entry zone, which acts as immediate resistance and confirms sellers are active at that area. The “bearish W” thesis implies a failure to sustain upside after a prior push, often preceding continuation into lower liquidity.
Dropping to the 4H context, the head and shoulders structure adds granularity: the break of structure signals that the prior bullish swing sequence is no longer intact and that downside impulses are starting to dominate. From a naked trading perspective, this is classic support resistance behavior—price reacts at a horizontal zone, forms a distribution top, then confirms with a structural break. The daily Fibonacci reference (-0.27) becomes the mapped extension objective if bearish continuation follows through.
Key Levels and Scenarios
Bearish continuation stays favored while price remains capped below the daily entry zone and the 4H head and shoulders structure holds post-break. A bullish recovery requires reclaiming the broken structure and invalidating the distribution top, shifting the market back into a corrective recovery rather than an impulsive selloff.
- Daily entry zone: key resistance area where rejection is currently visible
- 4H shoulder level: structural level referenced for invalidation risk after the break of structure
- 4H head level: deeper invalidation threshold for more conservative positioning
- Daily Fibonacci -0.27: downside objective referenced as the take-profit area
Trading Implications
TOTAL daily analysis remains structurally bearish while price respects resistance and the 4H break of structure stays valid. Aggressive traders typically focus on shoulder retests within the pattern, while conservative traders often wait for additional confirmation or use wider invalidation beyond the head—at the cost of tighter risk/reward. The cleanest framework here is structure-first, with Fibonacci as a supporting target tool rather than a decision driver.
This analysis is for informational purposes only and does not constitute financial advice.