


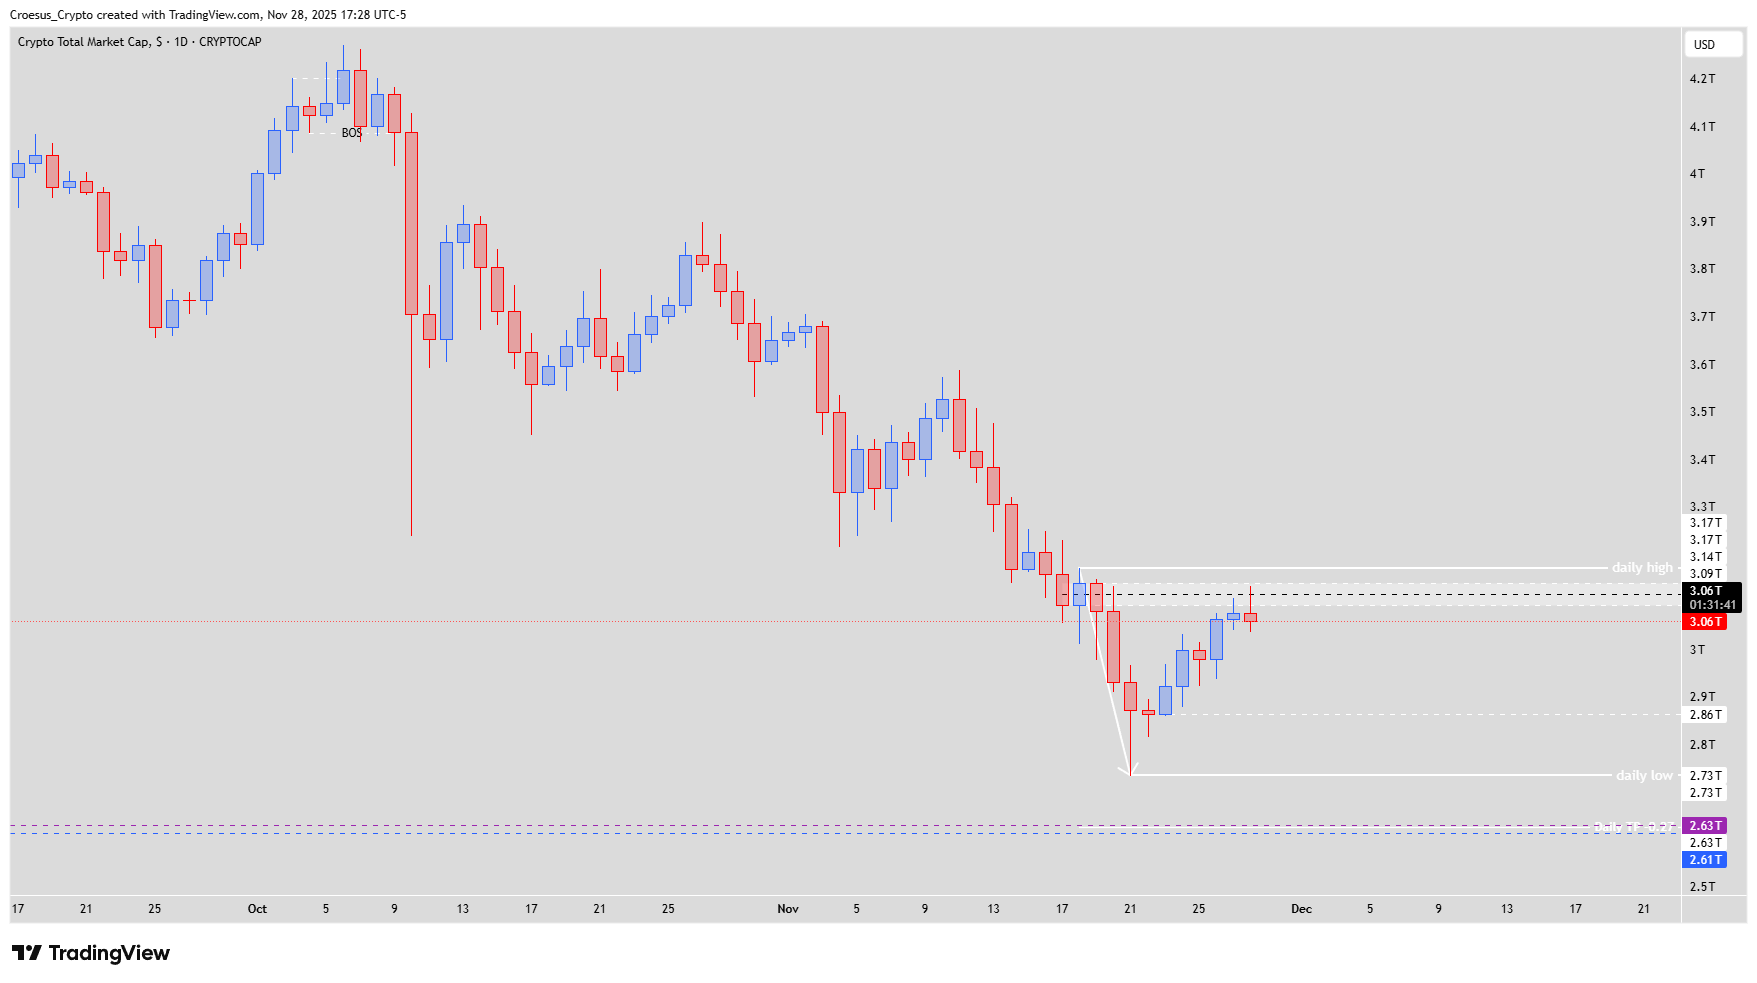
In this TOTAL daily analysis for November 2025 we see the index reacting from a key daily entry zone while still trading inside a broader corrective leg of the downtrend. Our technical analysis focuses on the current ABC correction into resistance and the developing 4H structure.
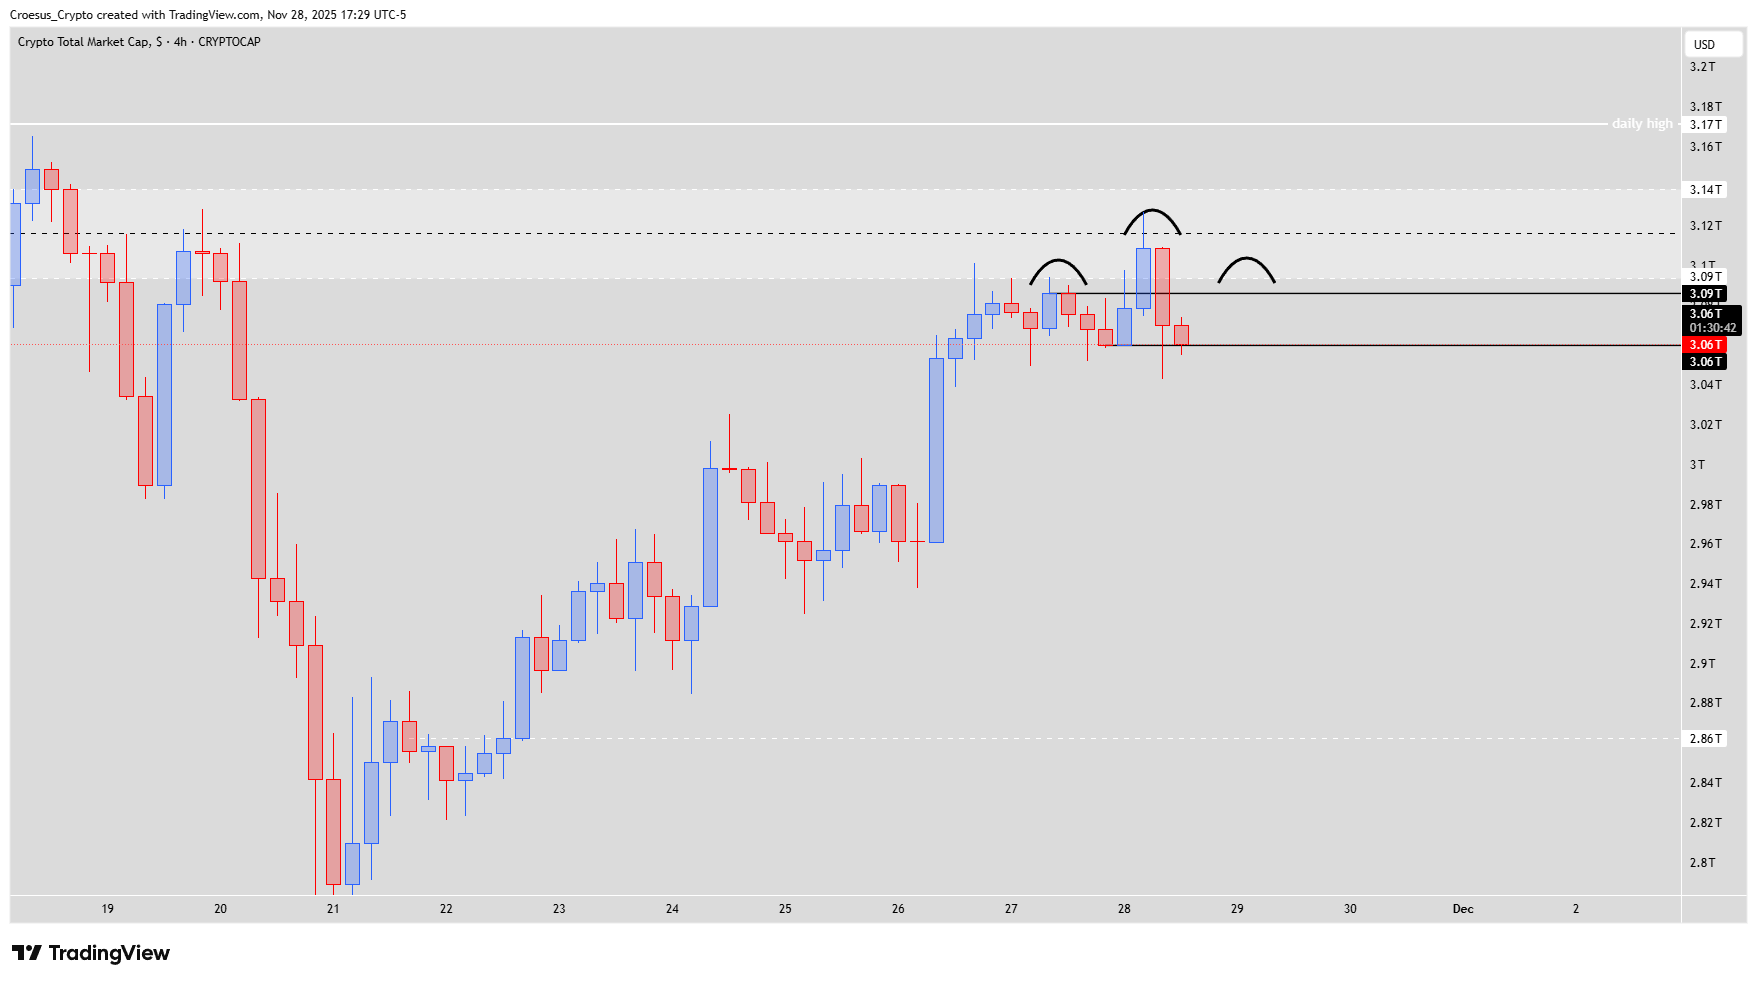
TOTAL 4H chart November 28 2025 with potential head and shoulder pattern near 3.09T resistance.
Trend = bearish
Technical Analysis Key Points
- The index hit the daily entry zone yesterday, pushed higher today, but was rejected.
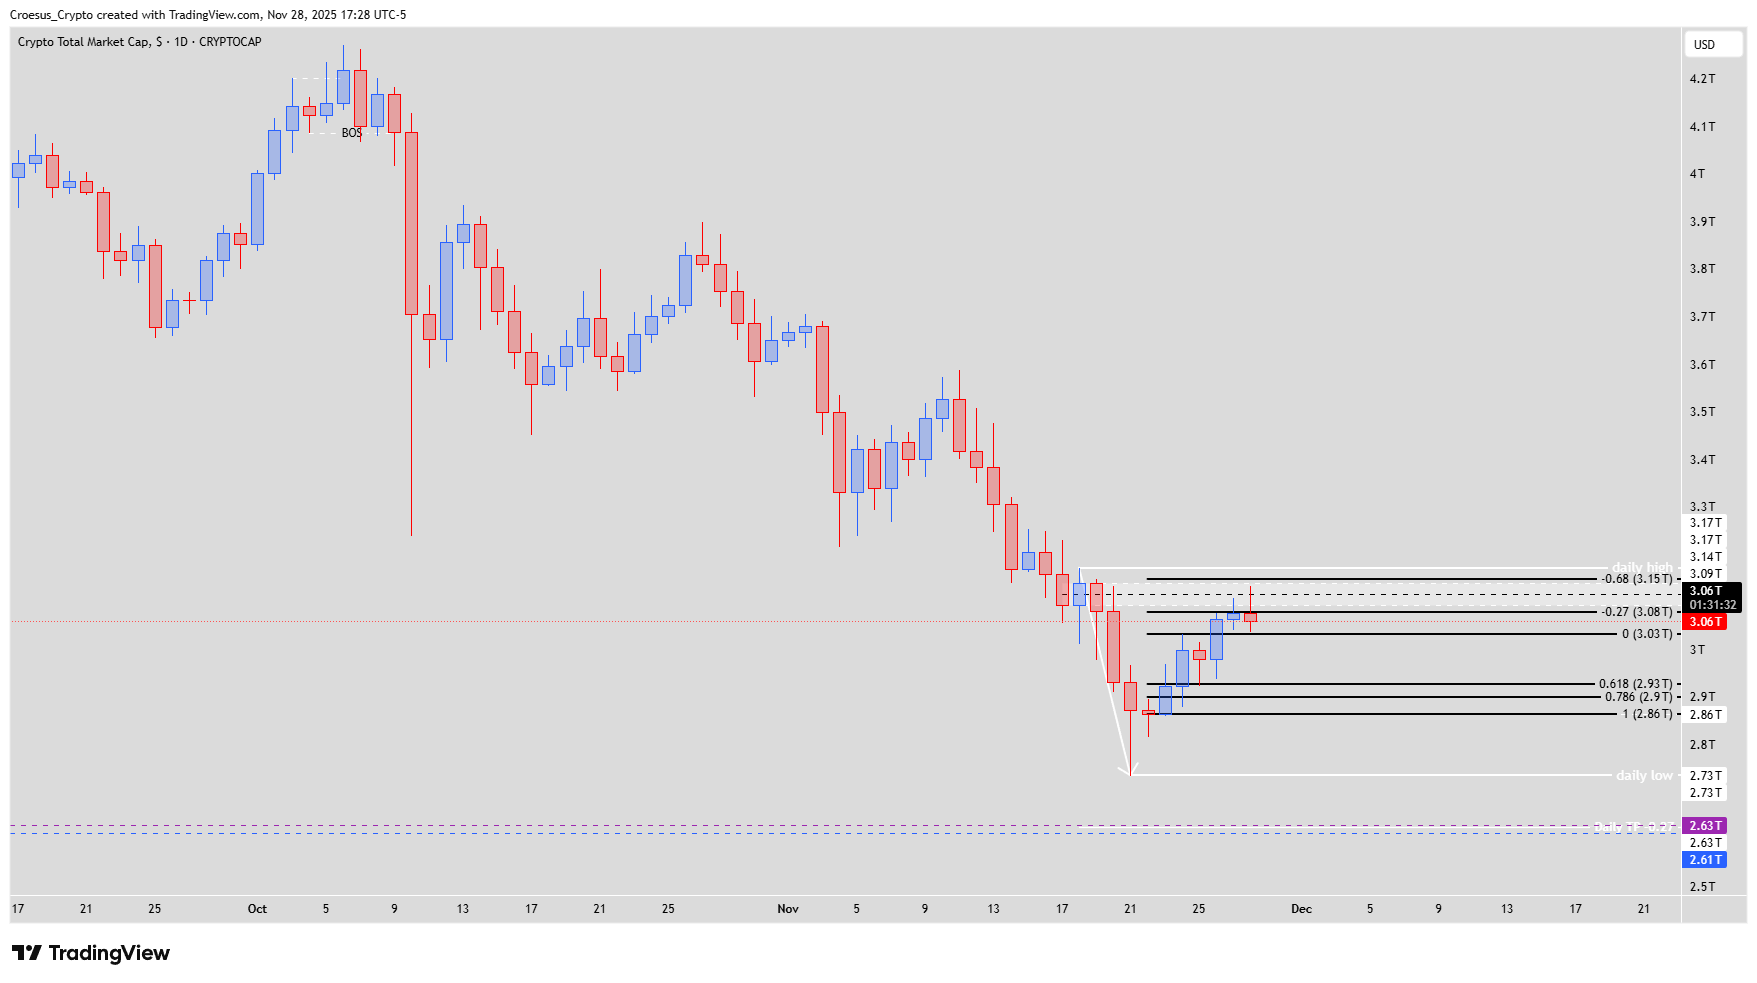
- We can look on the lower timeframe 4H for an entry pattern, but we still have to be cautious. If the ABC correction plays out completely, it will want to touch also the -0.68.
- If we look on the 4H timeframe we can see a potential head and shoulder pattern developing. But we remain cautious, there is still no break of structure. This means that we can still go for that daily -0.68 because without the break of structure this could still be a bullish M on the 4H.
- In order to get a bullish bias the index needs to break and close above the daily high @3.17T.
- At this moment our bias is still bearish : bullish correction until the first structure @ 3.09T followed by a bearish continuation to the 2.63 T. This level is confluent with the weekly shoulder level @ 2.61T.
Market Structure Analysis
From a market structure perspective, this TOTAL daily analysis shows price in a counter-trend rally after a strong impulsive sell-off. The rejection from the daily entry zone and lack of break of structure on 4H confirm that we are likely still inside an ABC corrective move. The potential 4H head and shoulder pattern forms directly under the first structure at 3.09T and below the daily high at 3.17T, keeping the broader support resistance context bearish. As long as 3.17T caps price, the Fibonacci -0.68 extension remains a valid magnet and the path of least resistance points back toward the 2.63T area, aligning with the weekly shoulder at 2.61T.
Key Levels and Scenarios
Bullish scenario: buyers need a clean break and daily close above 3.17T to invalidate the current corrective narrative and open room for a larger reversal leg.
3.17T – Daily high; must break/close above for a sustained bullish bias.
3.09T – First structure and key resistance in the current bullish correction.
-0.68 Fib extension – Completion level of the ABC correction if price extends higher first.
2.63T – Main downside continuation target for the bearish scenario.
2.61T – Weekly shoulder support, confluent with 2.63T and potential reaction zone.
Trading Implications
For active traders, this setup favors patiently stalking short entries on 4H confirmation patterns near 3.09T–3.17T, with risk defined above the daily high and potential reward toward 2.63T/2.61T, while avoiding aggressive longs until a clear break of structure occurs.
This TOTAL daily analysis is for educational purposes only and is not financial advice.