TOTAL Marketcap / Crypto Total Market Cap
TOTAL daily analysis 28/04/2026. The total crypto market cap is showing renewed weakness after rejecting from a key daily high zone, and our technical analysis focuses on whether this rollover develops into a larger distribution structure or triggers a final liquidity sweep first.
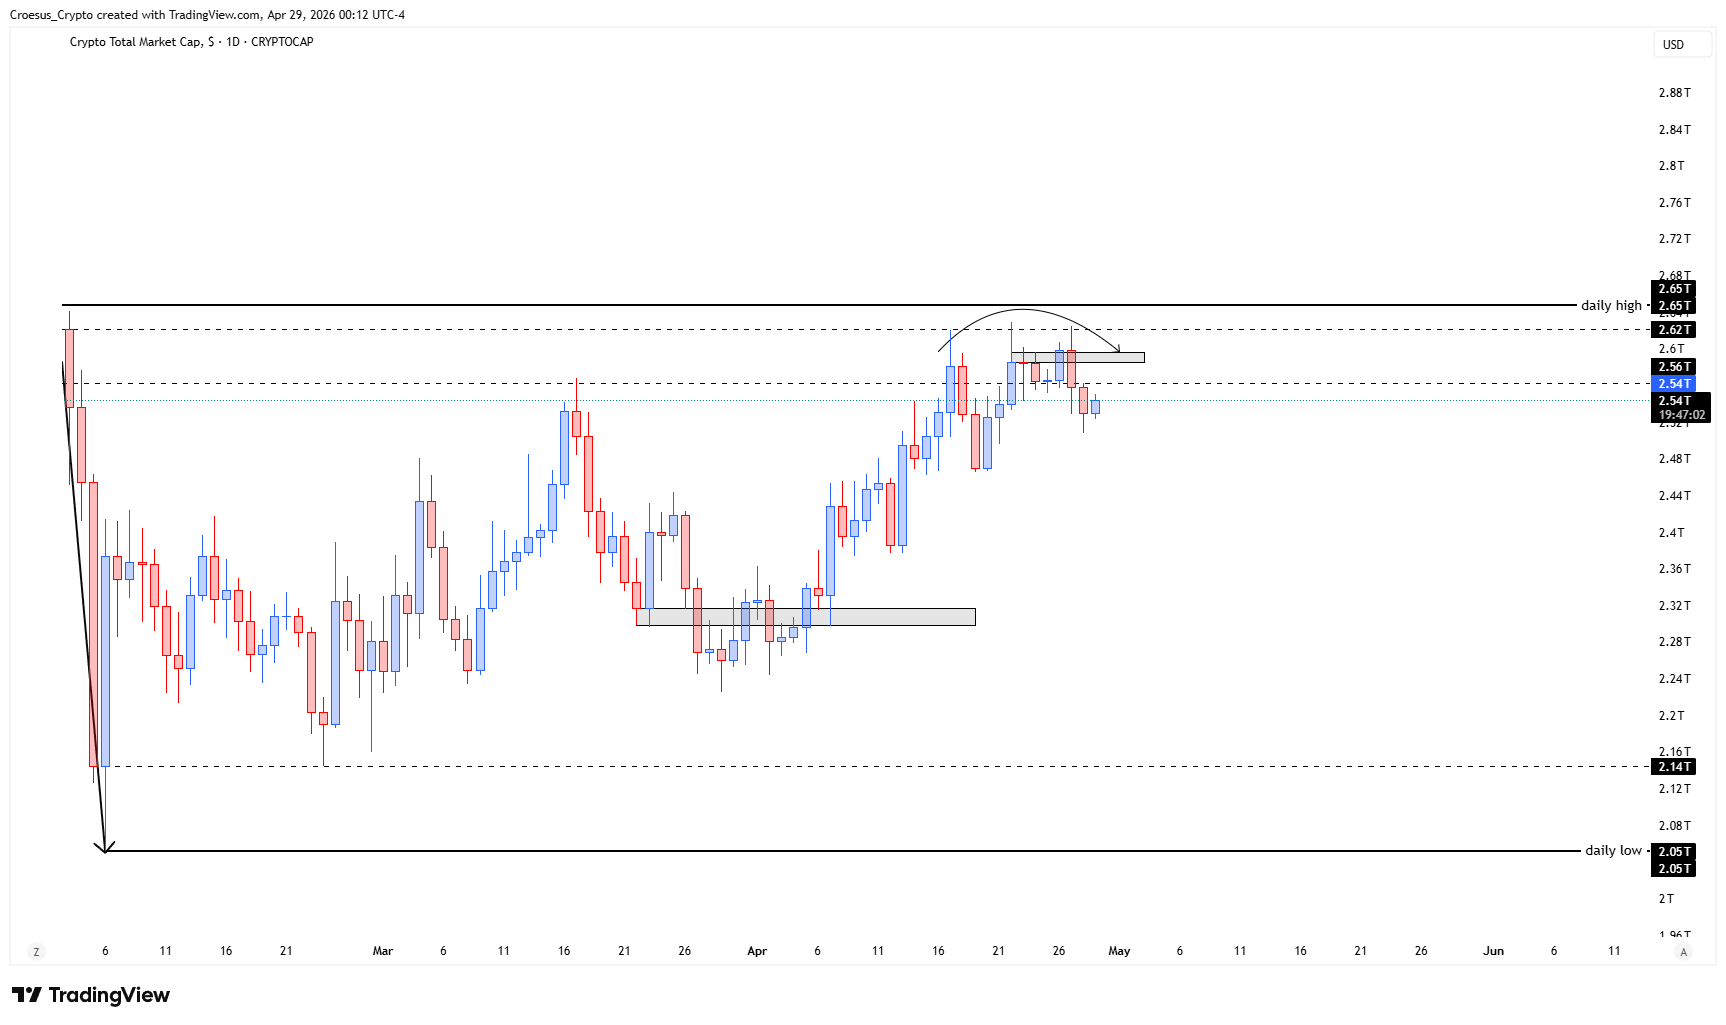
- TOTAL showed us a second bearish day after the retest of and rejection at the daily high zone.
- We can see a potential formation of a head and shoulders pattern.
- Price is rolling over. What is still open the chart, is that the daily high hasn't been touched yet. Resting liquidity above that level is still present. We might still see a sweep of liquidity above that level. Remain cautious.
Market Structure Analysis
From a naked trading perspective, the most important information in this TOTAL daily analysis is the sequence: retest into the daily high zone, rejection, and then a second bearish day. That type of follow-through often signals that sellers are defending a clear horizontal resistance area and that the market is attempting to transition from a corrective bounce into a fresh impulsive leg lower. The potential head and shoulders structure supports this bearish read as a classic distribution pattern, but it remains “potential” until the market confirms the breakdown and holds below the implied neckline area. The key structural nuance is the untouched daily high: with resting liquidity still above, the market can still run that liquidity first (a sweep) before committing to continuation, which would fit the cautionary framing in the draft.
Key Levels and Scenarios
In the bearish scenario, continuation is favored if price keeps rejecting from the daily high zone and maintains lower highs on the daily timeframe. A more complex scenario remains open if price first sweeps liquidity above the daily high, then quickly reclaims back below the zone—often a tell for a liquidity grab before the next bearish impulse. This keeps TOTAL daily analysis firmly centered on support resistance and clean structure confirmation rather than prediction.
- Daily high zone (retest and rejection area that currently caps upside)
- Daily high (untouched; resting liquidity remains above this level)
- Potential head and shoulders neckline area (confirmation/invalidation region if the pattern develops)
- Rejection swing area (prior lower high zone that defines current bearish structure)
This analysis is for informational purposes only and does not constitute financial advice.