


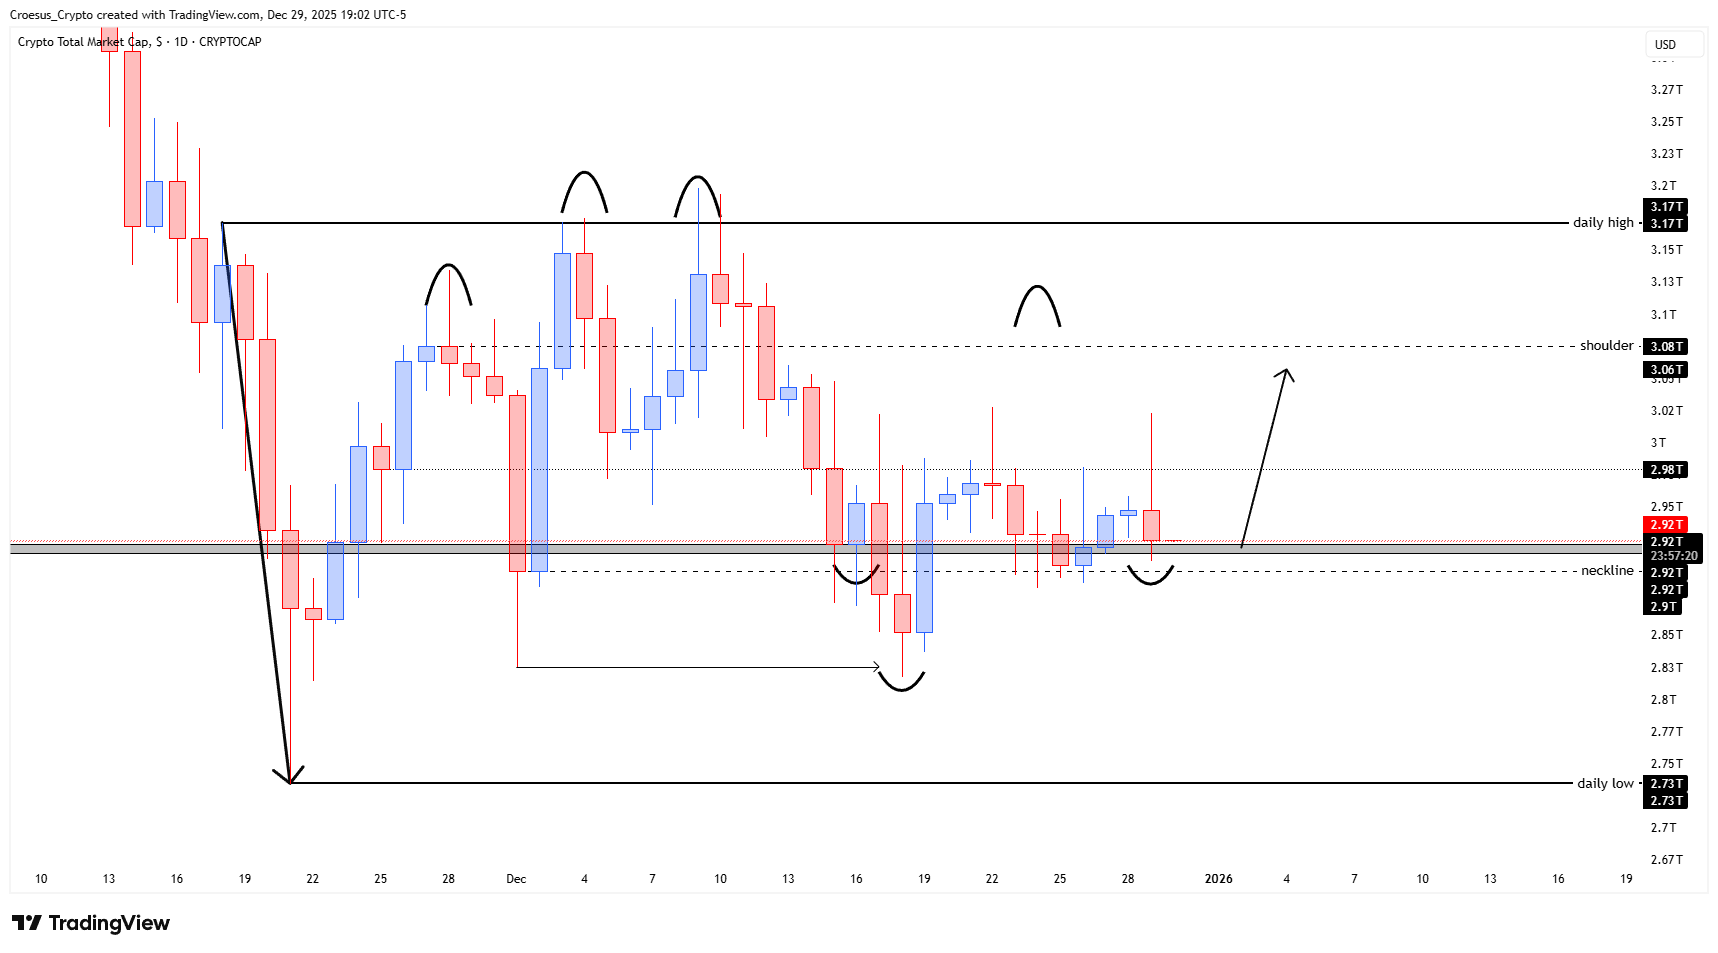
Our TOTAL daily analysis for late December 2025 focuses on the emerging inverse head and shoulders structure after a sharp decline into the 2.73T “daily low” area. Price is currently oscillating just above the marked neckline around 2.9T–2.92T, suggesting a potential accumulation phase before a larger move.
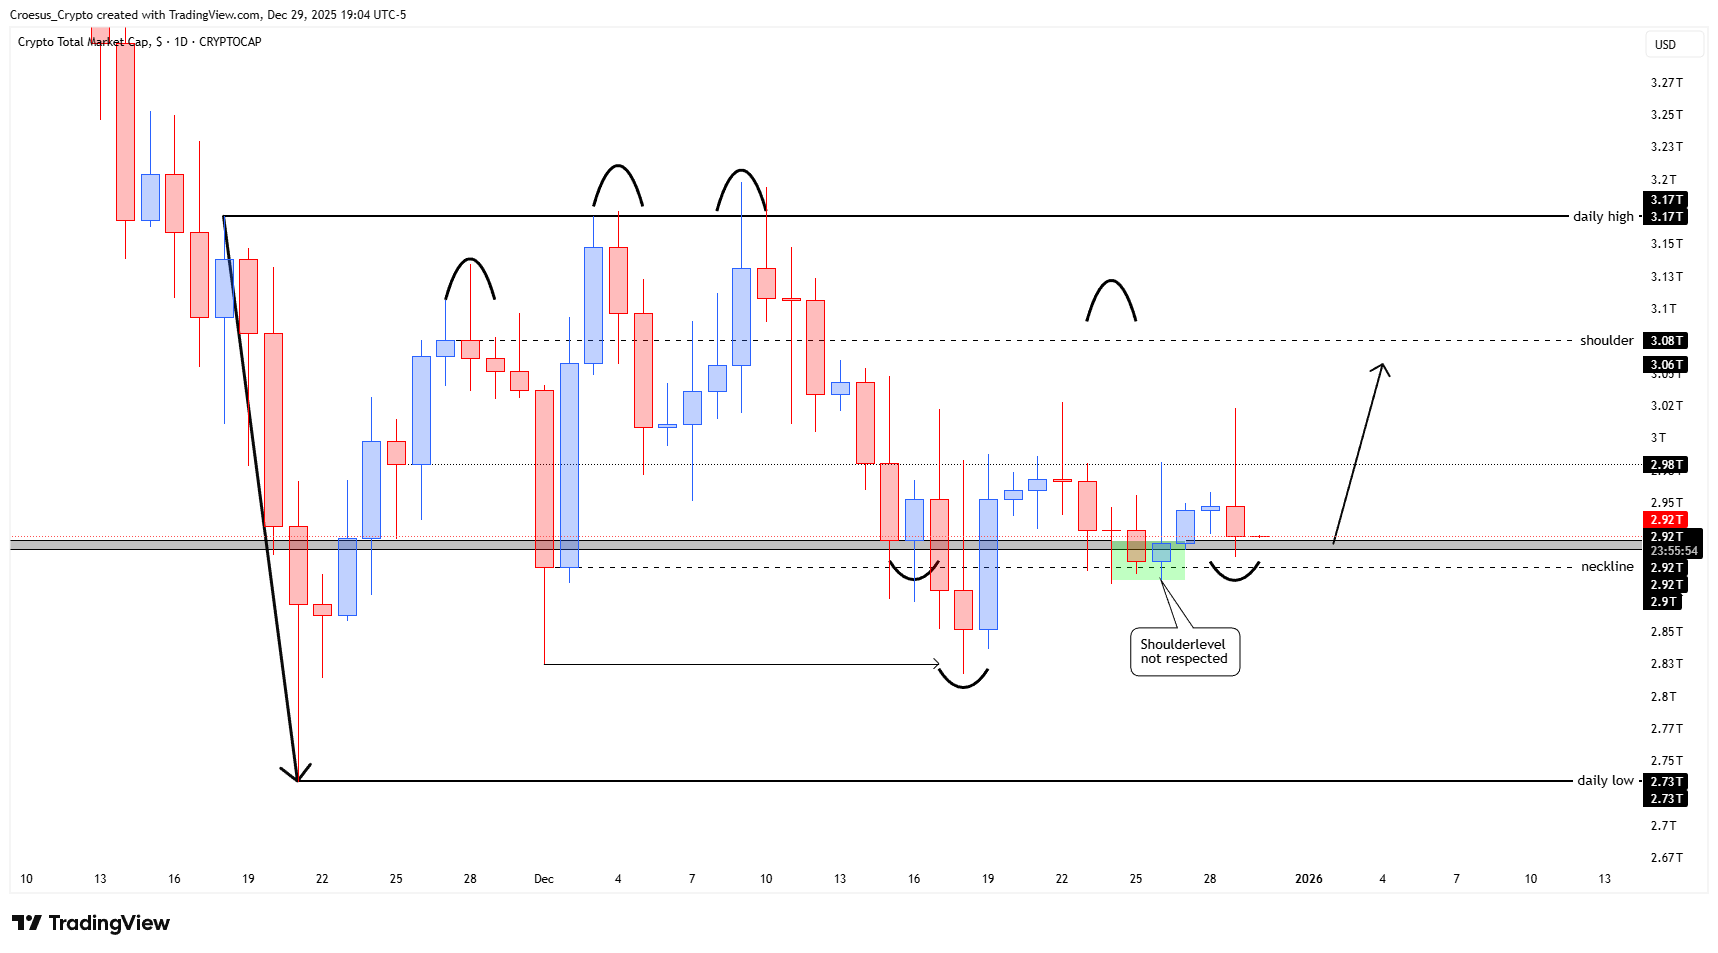
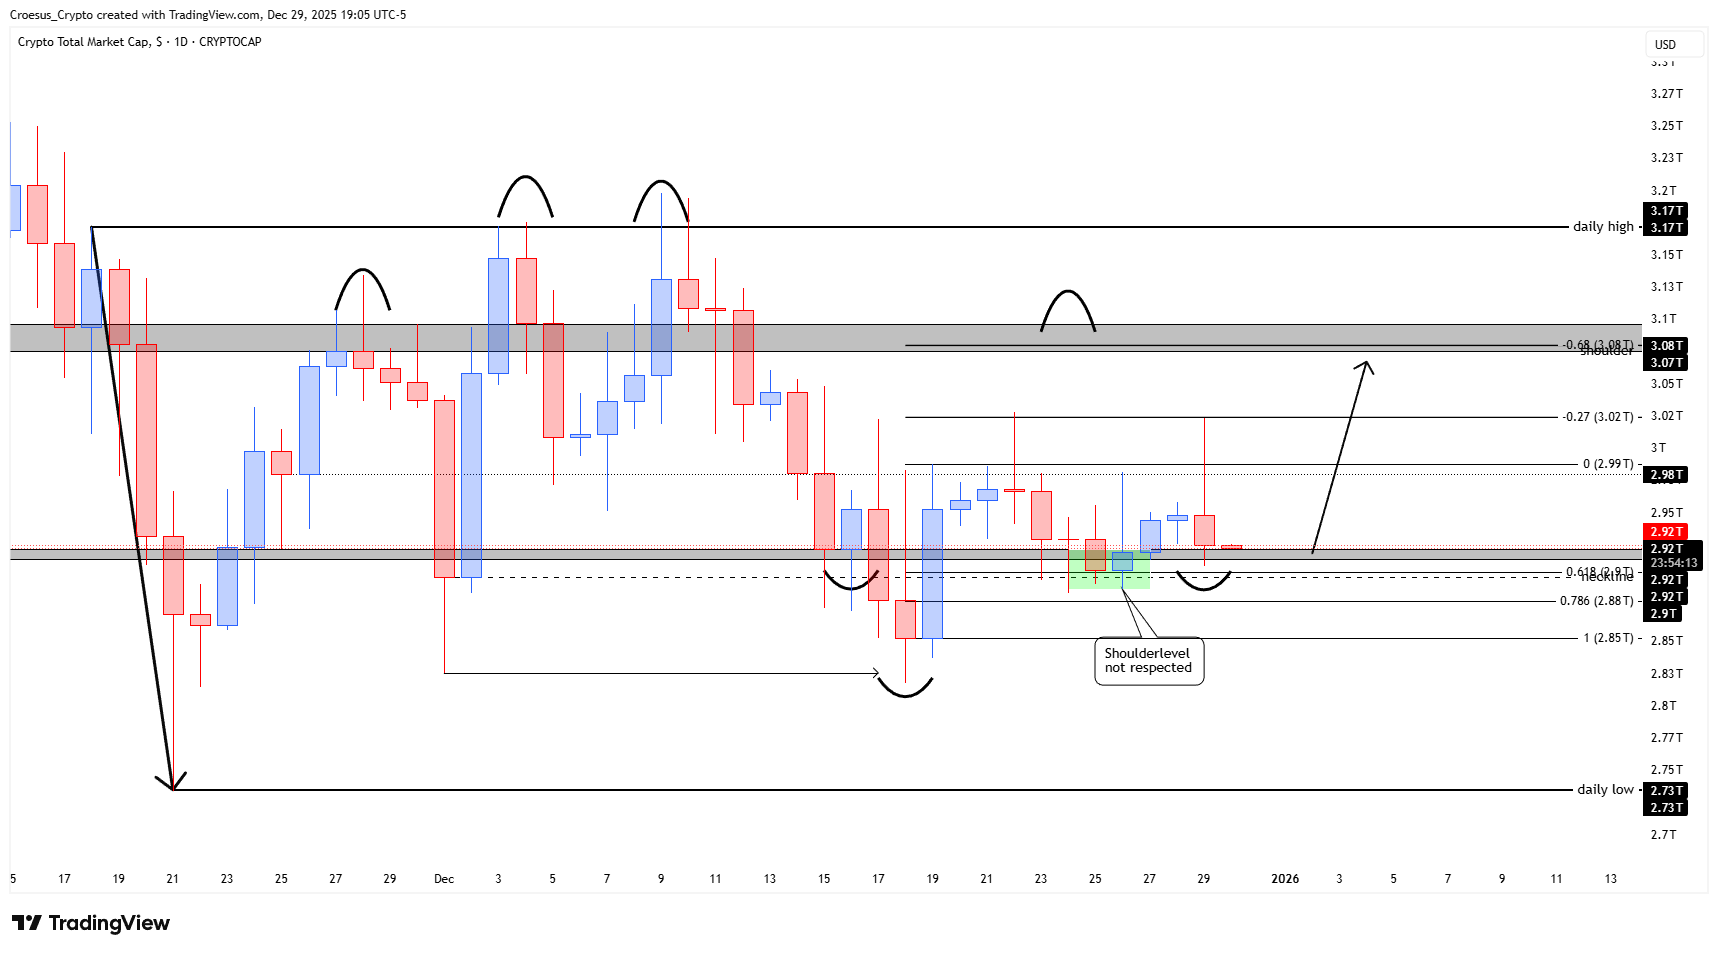
TOTAL daily chart Dec 23 2025 with inverse head and shoulders setup, 2.93T retest, and resistance toward 3.08T/3.17T
Technical analysis
- Strong vertical selloff into the 2.73T daily low followed by a base-building range
- Clear inverse head and shoulders structure with neckline around the 2.9T–2.92T zone
- Multiple failed pushes above the 3.06T–3.08T “shoulder” resistance and 3.17T daily high
- Current daily candles show consolidation and higher lows around the neckline support
Market Structure Analysis
Structurally, TOTAL has shifted from pure downtrend into a sideways range where buyers repeatedly defend the 2.73T–2.9T band. The inverse head and shoulders visible on the daily timeframe is a classic reversal pattern in technical analysis, often signaling exhaustion of selling pressure and the start of a new impulse if the neckline holds. At a first attempt the 2.92T wasn't respected, so we are retesting this level again.
Overhead, we see clear support resistance clusters: first at ~2.98T, then the shoulder zone at 3.06T–3.08T, and finally the 3.17T daily high. A sustained daily close above the neckline would confirm demand stepping in, aligning with a bullish TOTAL daily analysis. Fibonacci confluence around these prior highs would further strengthen the case if added to the chart.
Note that this is still a bullish correction of a strong bearish impulse.
Key Levels and Scenarios
Bullish scenario:
As long as daily closes hold above roughly 2.9T, our bias is for an upward rotation toward 2.98T, then 3.06T–3.08T. A breakout above 3.08T would likely target the 3.17T daily high, effectively completing the inverse H&S projection.
Levels to watch
2.73T – Major daily low and invalidation of bullish reversal if broken
2.90T–2.92T – Neckline support; key for maintaining bullish structure
2.98T – First resistance and range mid; reaction zone
3.06T–3.08T – Shoulder resistance; breakout trigger for continuation
3.17T – Daily high and potential medium-term target
Trading Implications
Bias: we treat TOTAL as range-to-bullish while daily closes hold above the 2.9T–2.92T neckline.
Long idea: look for dips into 2.9T–2.92T that hold (wick below / close back above) as potential entry zones. Look on lower timeframes as 4H for strong entry patterns (inverse head and shoulders, bullish M)
First targets: 2.98T, then 3.06T–3.08T shoulder; stretch target 3.17T daily high.
Invalidation: a clean daily close back below ~2.9T weakens the inverse H&S; a break of 2.73T daily low fully invalidates the bullish setup.
Risk: keep position size modest until we see a strong daily impulse away from the neckline; stops typically go just below the neckline or, more conservatively, below 2.73T depending on your timeframe.
This is not financial advice; always do your own research and manage risk accordingly. The structure of this analysis follows our internal trade plan framework