TOTAL Marketcap / Crypto Total Market Cap
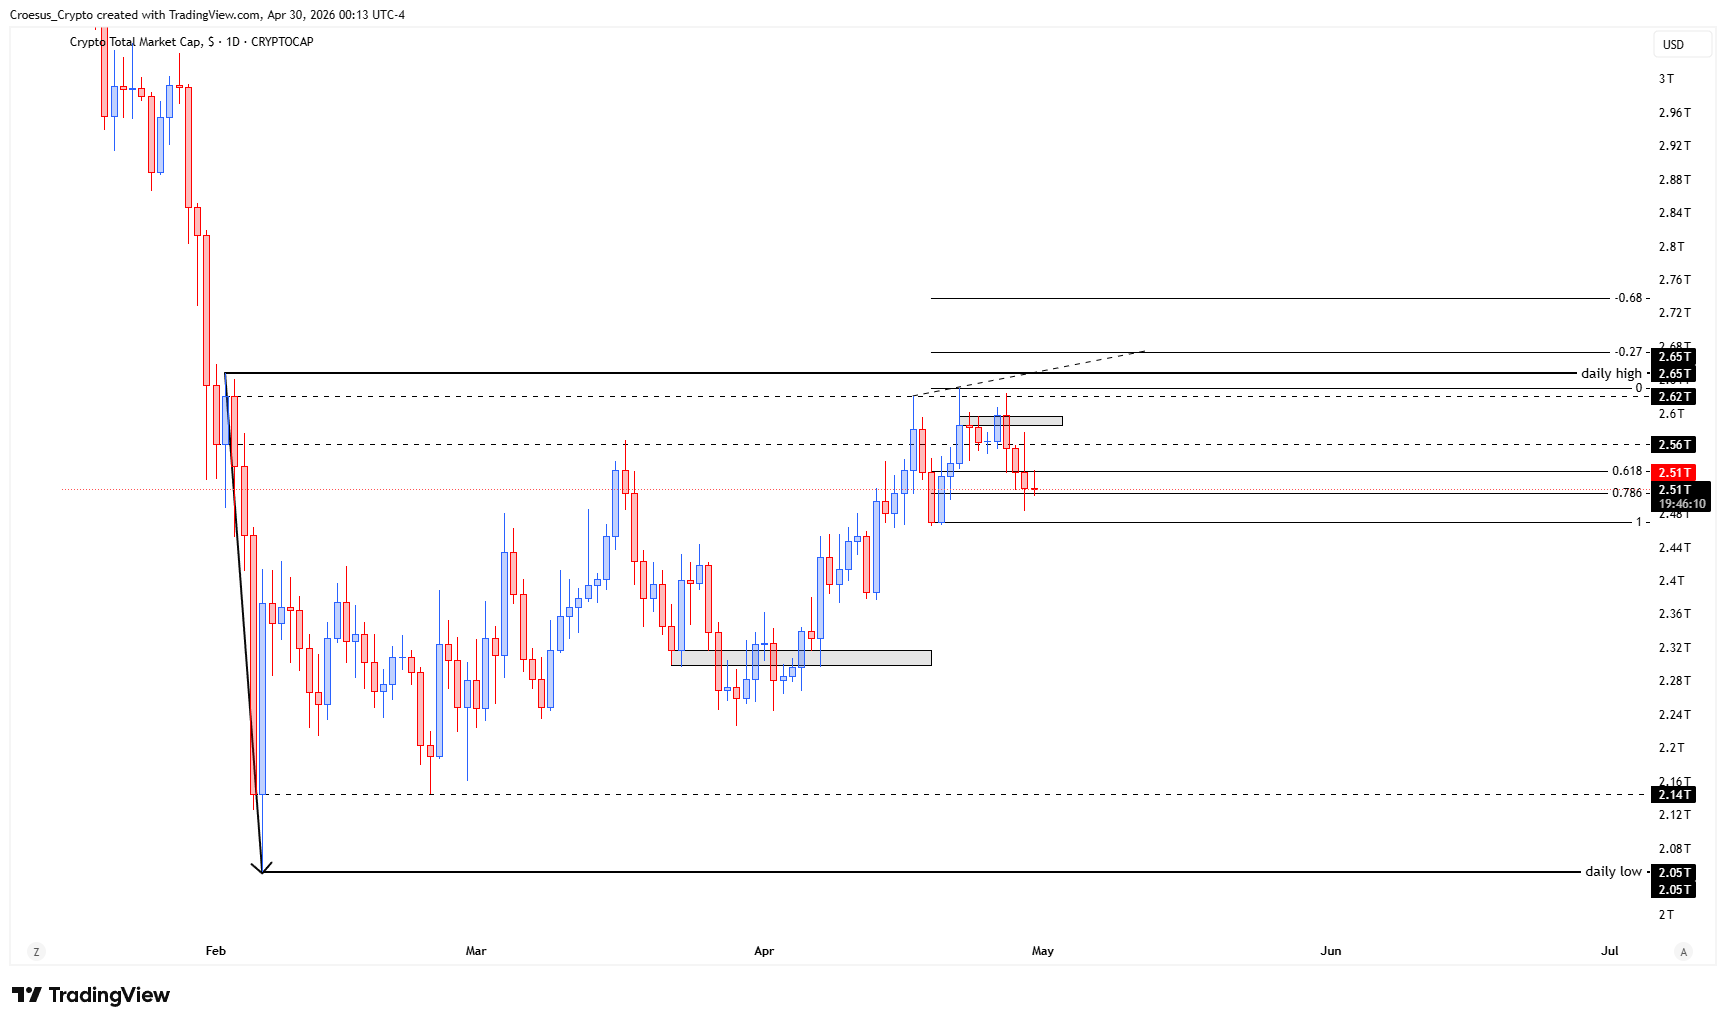
TOTAL daily analysis 29/04/2026. The total crypto market cap index remains under pressure after a news-driven spike in volatility, with price ultimately resolving to the downside and keeping the broader structure bearish.
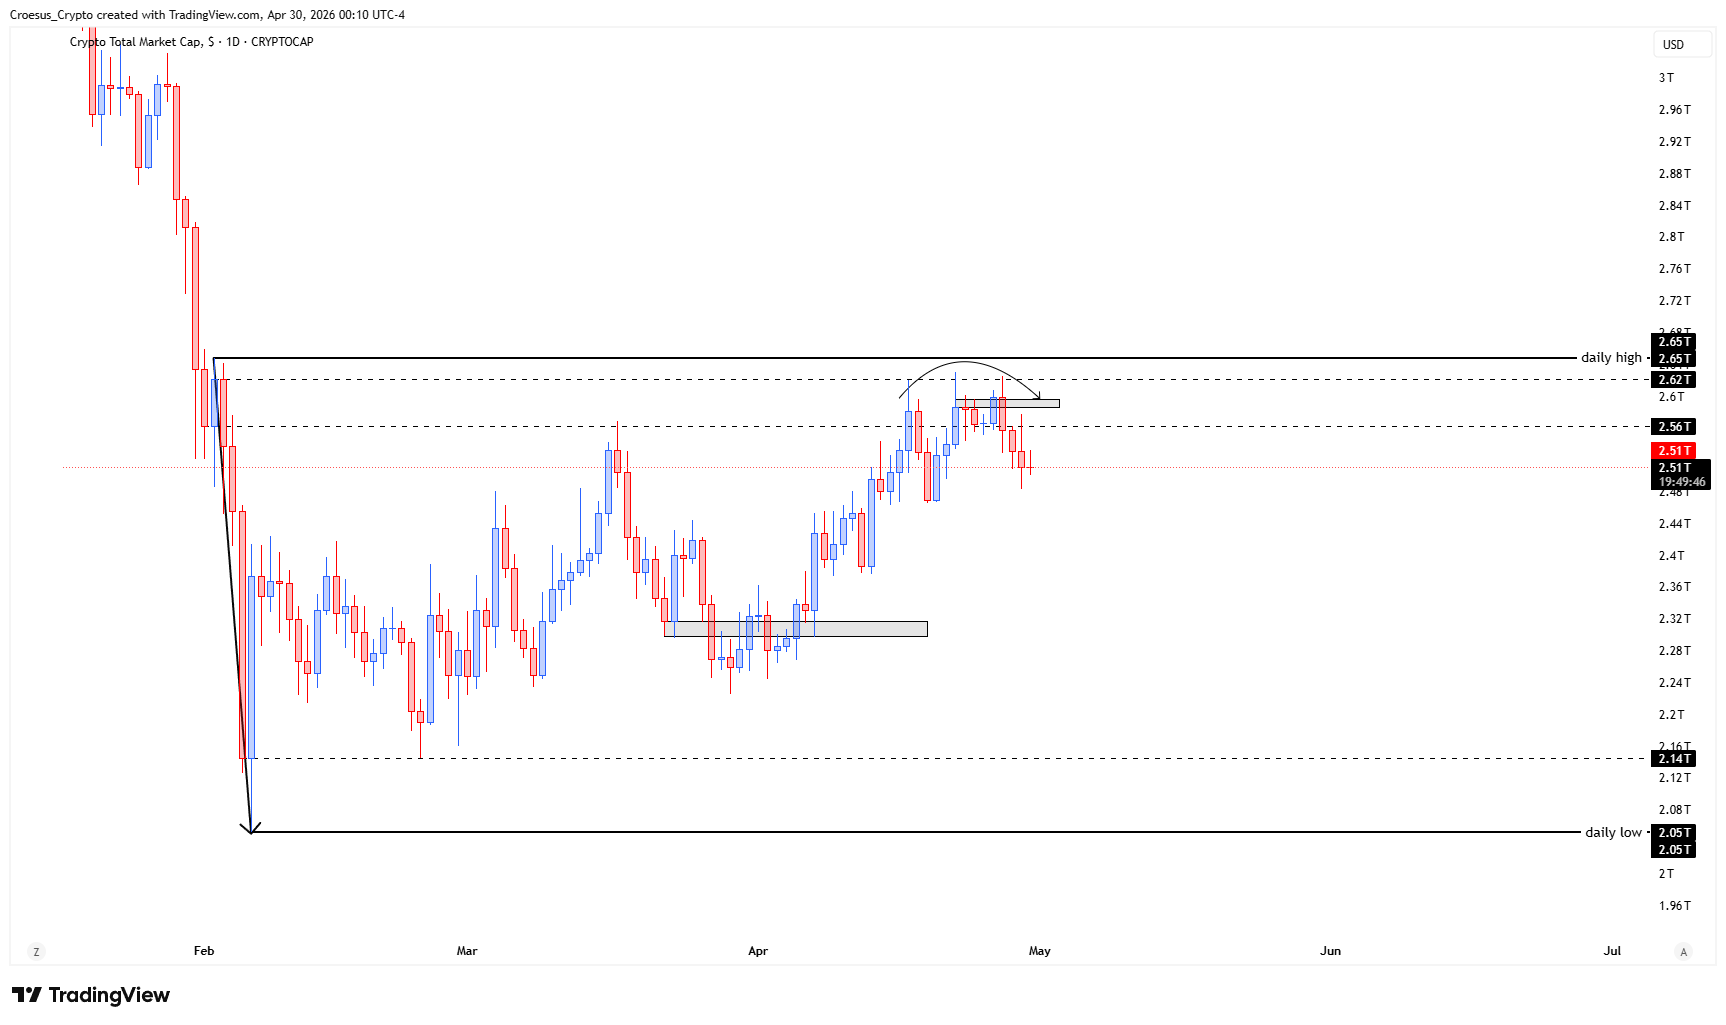
- In anticipation of the FOMC meeting and press conference we saw a volatile day but finally pushing the index further south.
- We still miss a sweep of that daily high. Does it need to come ? No. But fact is that a lot of liquidity is resting there and that market makers want to take the easy targets first.
Market Structure Analysis
From a naked trading perspective, our TOTAL daily analysis focuses on the reaction to event volatility and where liquidity is likely resting. The FOMC session produced an expansion in range, but the close and follow-through push the index further south, which keeps the immediate sequence skewed to bearish continuation.
Structurally, the daily high acts as a clear liquidity magnet (resting stops above a prior intraday swing), and the fact it remains unswept means price can still rotate back upward to take those easy targets before resuming direction. That said, an unswept high is not a requirement—bear trends can extend by pressing into lower support resistance zones first, especially when selling is impulsive and the market is prioritising downside discovery.
Key Levels and Scenarios
In this TOTAL daily analysis, the main decision points are defined by the unswept daily high overhead and the nearest downside support area created by the post-event sell-off. A bearish continuation scenario stays in play while price fails to reclaim key resistance and keeps making lower intraday highs. A relief bounce scenario becomes more likely if price rotates back to sweep the daily high liquidity and then shows rejection from that zone.
- The prior daily high (overhead liquidity pool and potential sweep zone)
- The breakdown area from the volatile FOMC session (near-term resistance on retest)
- The current downside extension / session low area (near-term support to watch)
- Any range low formed after the push south (support that, if broken, confirms continuation)
Trading Implications
Given the event-driven volatility, execution risk is elevated and structure can shift quickly. Conservative traders typically wait for a clear retest/rejection at resistance or a confirmed breakdown through support, while aggressive traders may focus on the liquidity-sweep narrative around the daily high—only if price action confirms it with a clean reaction.
This analysis is for informational purposes only and does not constitute financial advice.