


TOTAL Marketcap / Crypto Total Market Cap
TOTAL daily analysis 28/05/2026. TOTAL is trading at a major weekly support resistance zone (weekly first structure), which makes this area a potential inflection point despite the current bearish context on higher timeframes. Our TOTAL weekly analysis focuses on whether this level holds as a base for a reversal, or fails and opens continuation to the downside.
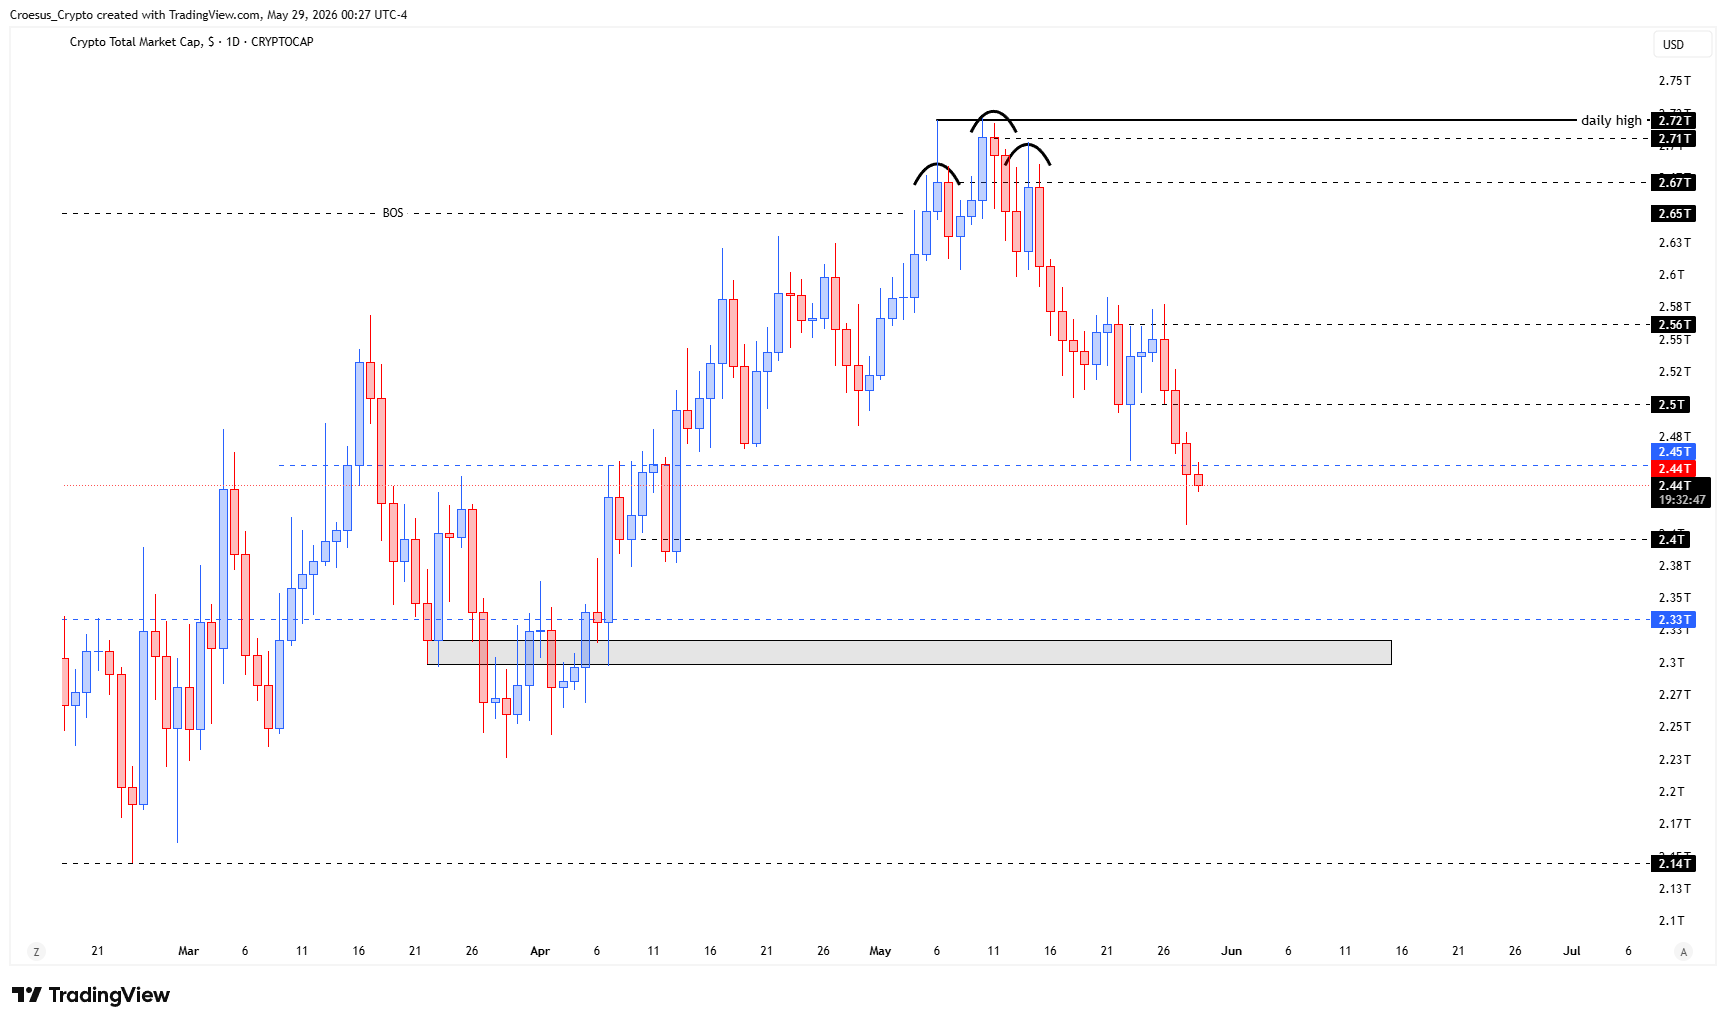
- TOTAL hit a weekly level (weekly first structure. This could be a reversal point.
- We need to see, on the 4H timeframe, some kind of a sign of reversal (inverse H&S or bullish continuation)
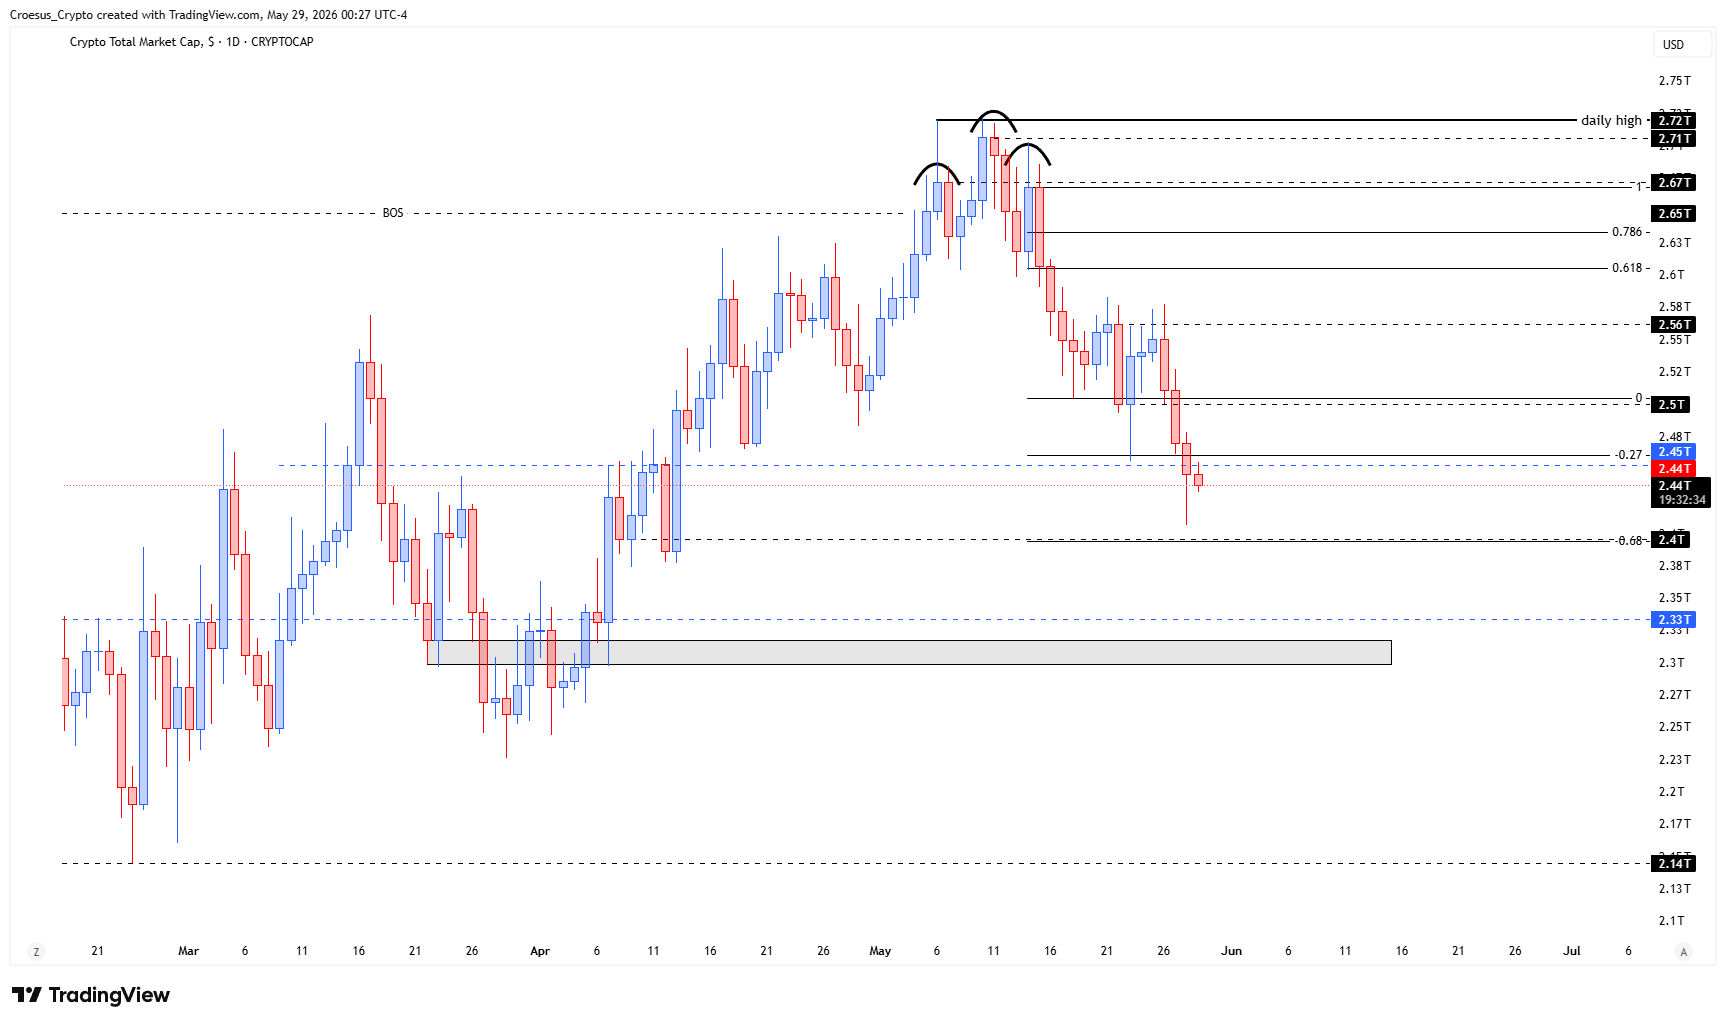
Market Structure Analysis
Structurally, the key information in this TOTAL weekly analysis is the reaction into a predefined weekly level (the first structure). In Croesus methodology, these first-touch higher timeframe levels often act as the cleanest decision points: either price prints a clear base (accumulation) and transitions into a bullish impulse, or the level breaks and confirms bearish continuation. Because the higher timeframe trend is bearish, we want to see evidence that sellers are losing control before treating this as a reversal. That confirmation is expected to come from the lower timeframe (4H) via a recognizable reversal structure like an inverse head and shoulders, or a bullish continuation pattern that establishes higher lows and then breaks a local swing high (break of structure).
Key Levels and Scenarios
Bearish continuation remains the default until the market proves otherwise. A bullish outcome requires a defended weekly base and a confirmed 4H break of structure that turns prior resistance into support.
- Weekly first structure: primary decision level for support resistance
- 4H local swing high: needs to break to signal reversal traction
- 4H higher-low zone: must hold to keep a developing reversal valid
- Prior breakdown area: likely overhead resistance on any bounce
This analysis is for informational purposes only and does not constitute financial advice.