


Our TOTAL daily analysis for 30 November 2025 highlights how price is repeatedly rejecting the same daily entry zone, while intraday structure on the 4H confirms a bearish technical analysis bias via a clear head and shoulders pattern. This TOTAL daily analysis therefore keeps a focus on support resistance interaction and the unfinished ABC Fibonacci correction.
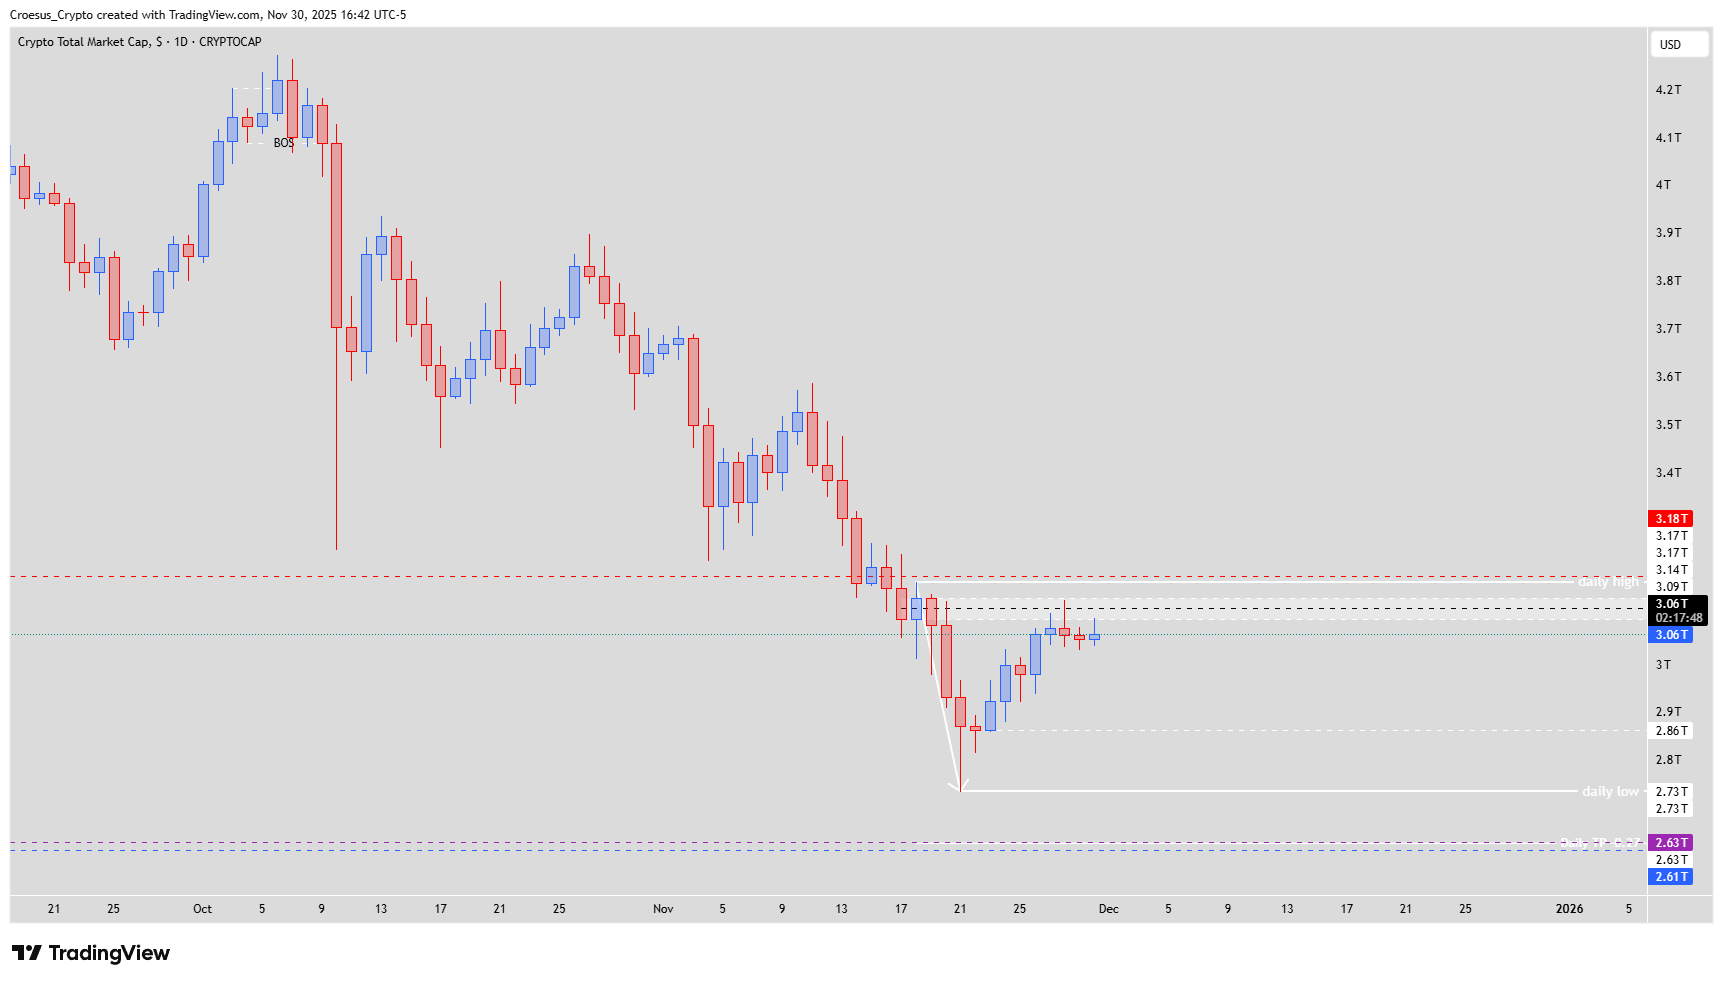
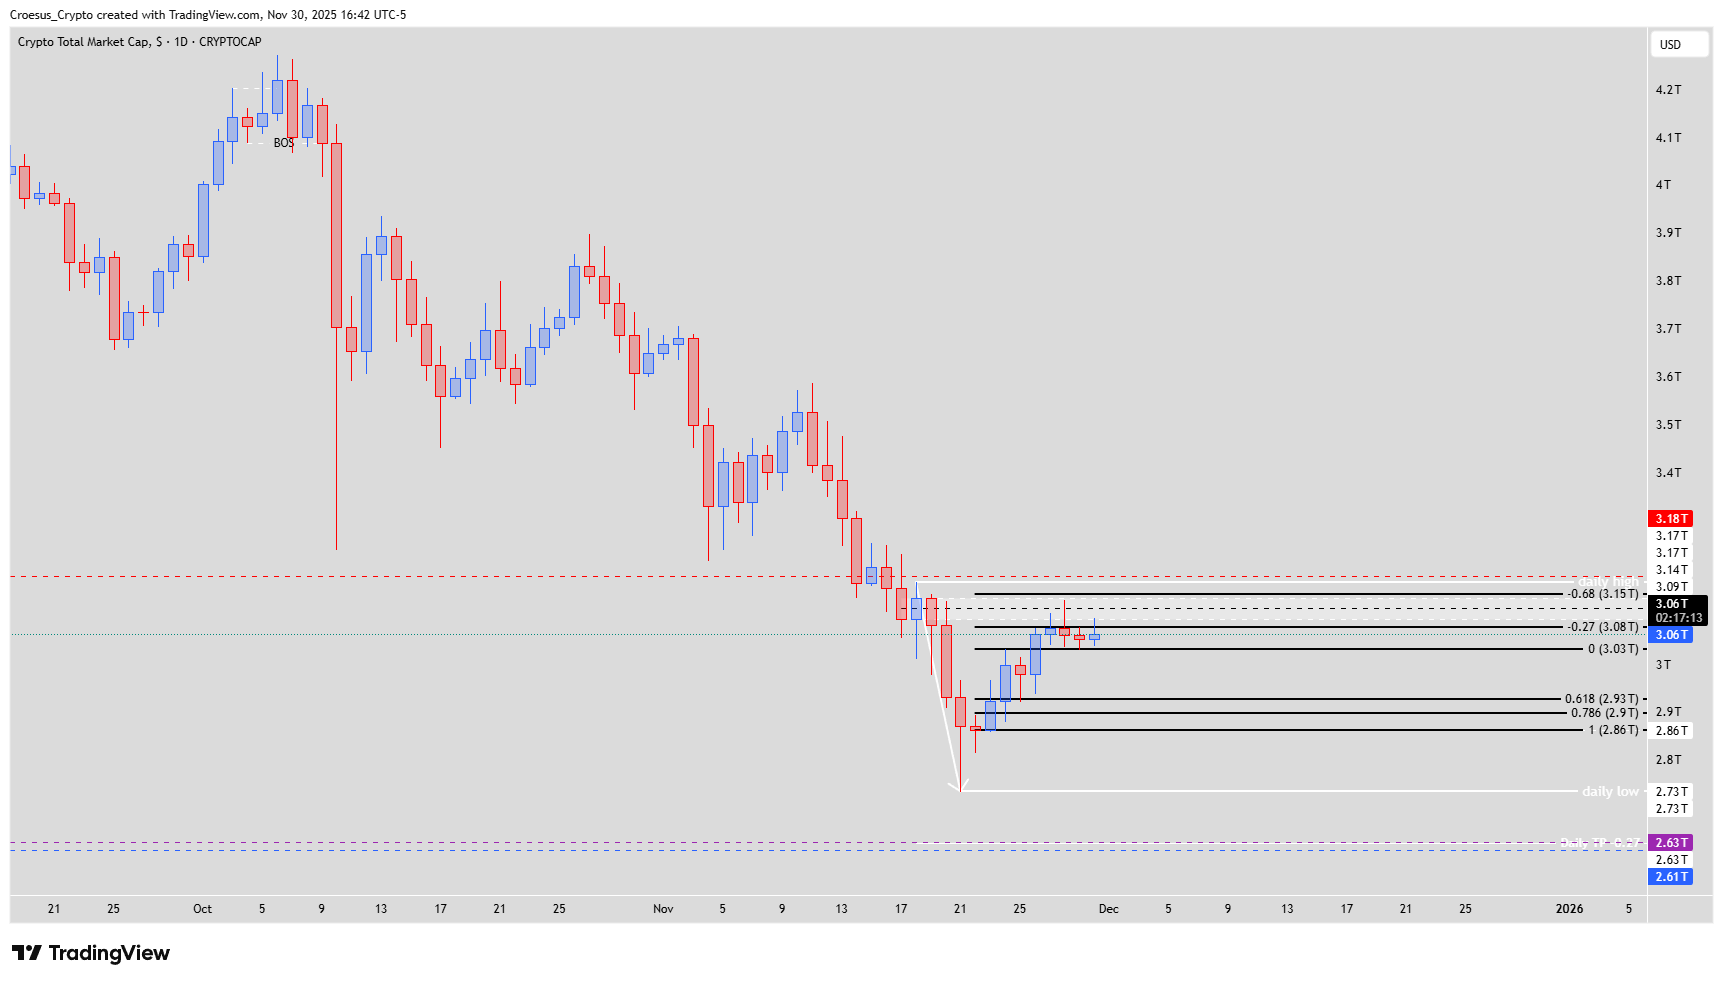
TOTAL daily chart 30 Nov 2025 focusing on daily entry zone, daily high at 3.17T and lower support levels.
Trend = bearish
Technical Analysis Key Points
- On Friday the index hit the daily entry zone for the second time followed by rejection. On Saturday we saw the index having a slight further rejection.
- But today the index retested the daily entry zone, but still no convincing reclaim of the daily entry zone. After hitting it for the third time, we might building up a stronger resistance area.
- We still have to take into account that the -0.68 of daily ABC correction has not been hit yet.
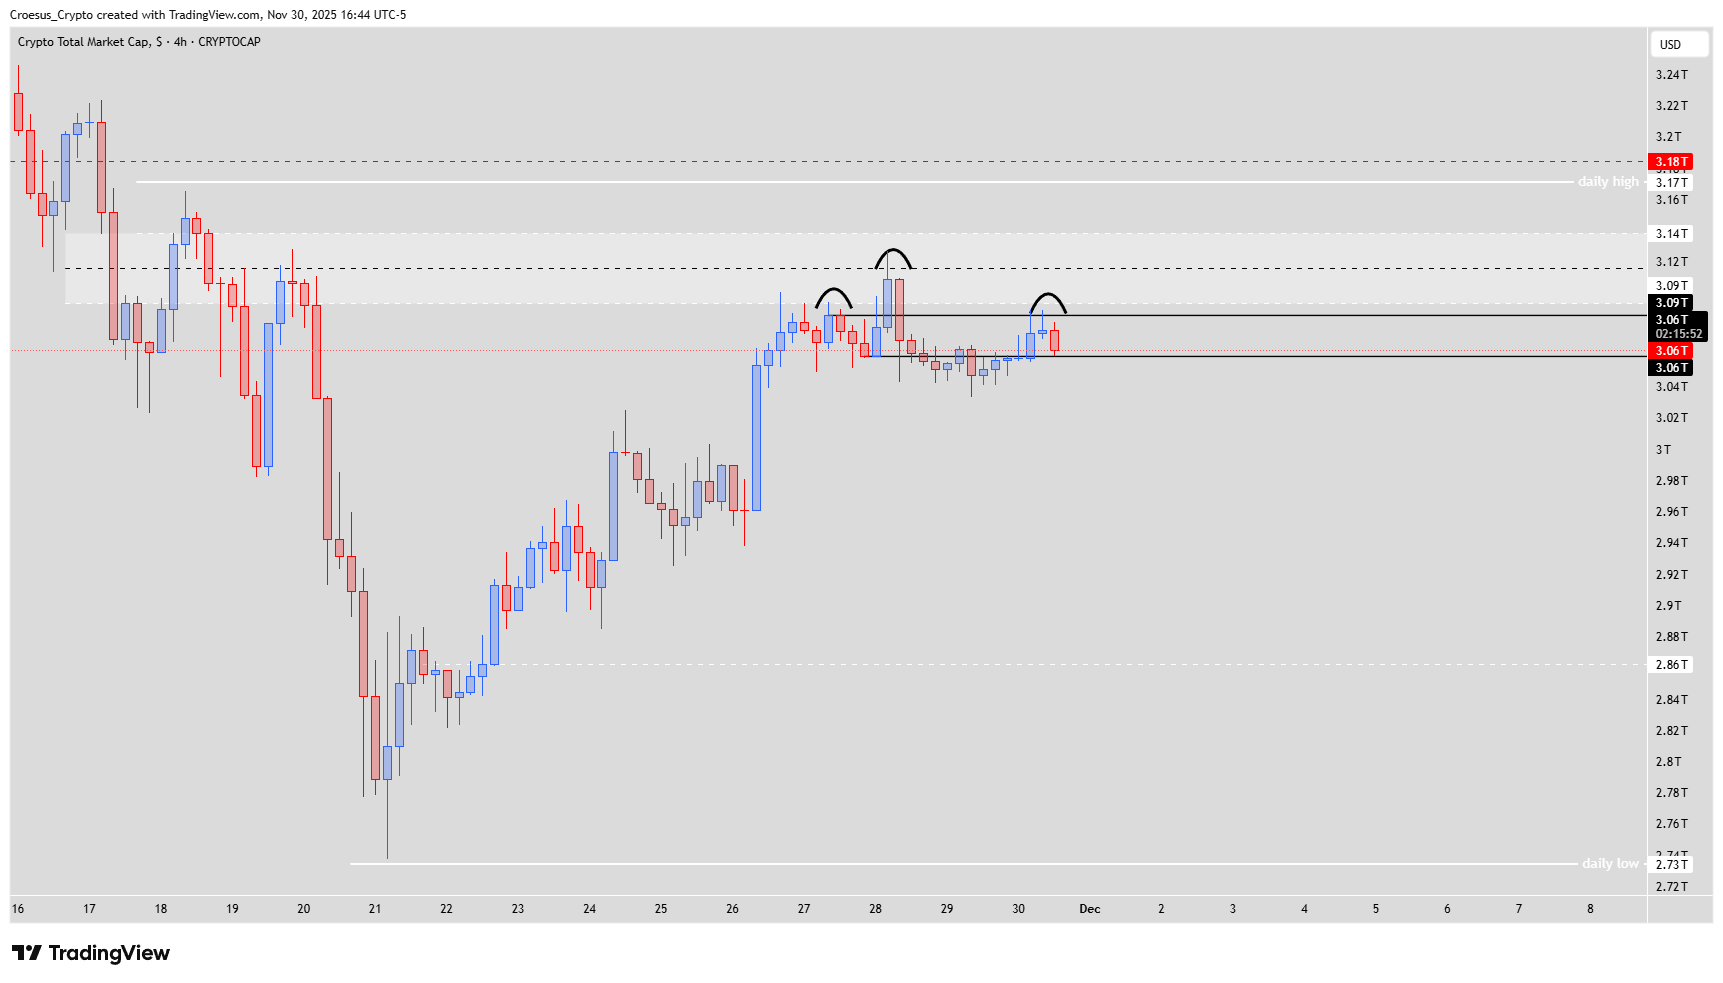
- If we zoom in on the 4H time frame we can that the head and shoulders pattern has taken form. The shoulder 2 level has been printed and we can see now further bearish continuation. An entry on the shoulder level with a stoploss slightly above the head would have been a valid entrylevel.
- In order to get a bullish bias the index needs to break and close above the daily high @3.17T.
- At this moment our bias is still bearish : bullish correction until the first structure @ 3.09T followed by a bearish continuation to the 2.63 T. This level is confluent with the weekly shoulder level @ 2.61T.
Market Structure Analysis
The broader market structure on this TOTAL daily analysis is corrective after a sharp downswing, with price oscillating around the daily entry zone but failing to reclaim it decisively. Three consecutive taps into the same zone typically reinforce it as resistance and suggest supply is defending this area. At the same time, the -0.68 level of the daily ABC Fibonacci correction remains untested, leaving a downside extension target open.
On the 4H chart, the completed head and shoulders pattern adds confluence to the bearish view. Shoulder 2 has been respected, and the idea of an entry at that shoulder with a stop above the head fits our naked trading playbook and confirms that rallies into this structure are currently sell opportunities.
Key Levels and Scenarios
Bullish scenario: only if the index breaks and closes back above the daily high at 3.17T, reclaiming the entry zone and invalidating the 4H head and shoulders, we can then look for a sustained corrective leg higher.
Key levels to watch:
3.17T – daily high that must be closed above to shift bias to bullish.
Daily ABC -0.68 Fibonacci extension – still unfilled and acting as a potential upside magnet.
Daily entry zone – tested three times and acting as reinforced resistance.
3.09T – first structure target for a short-lived bullish correction.
2.63T – main bearish continuation target, aligned with weekly shoulder support around 2.61T.
Trading Implications
For now, rallies into the daily entry zone and 4H shoulder region favor short setups with tight risk above the head/3.17T, while conservative traders may wait for either a clean daily close above 3.17T or a move down toward 2.63T before looking for fresh opportunities.
This TOTAL daily analysis is for educational purposes only and is not financial advice.