


TOTAL Marketcap / Crypto Total Market Cap
TOTAL daily analysis 30/03/2026. The total crypto market cap index is reacting from the lower end of its daily range, but our technical analysis stays defensive as the broader context still leans bearish and the current structure can resolve in either direction.
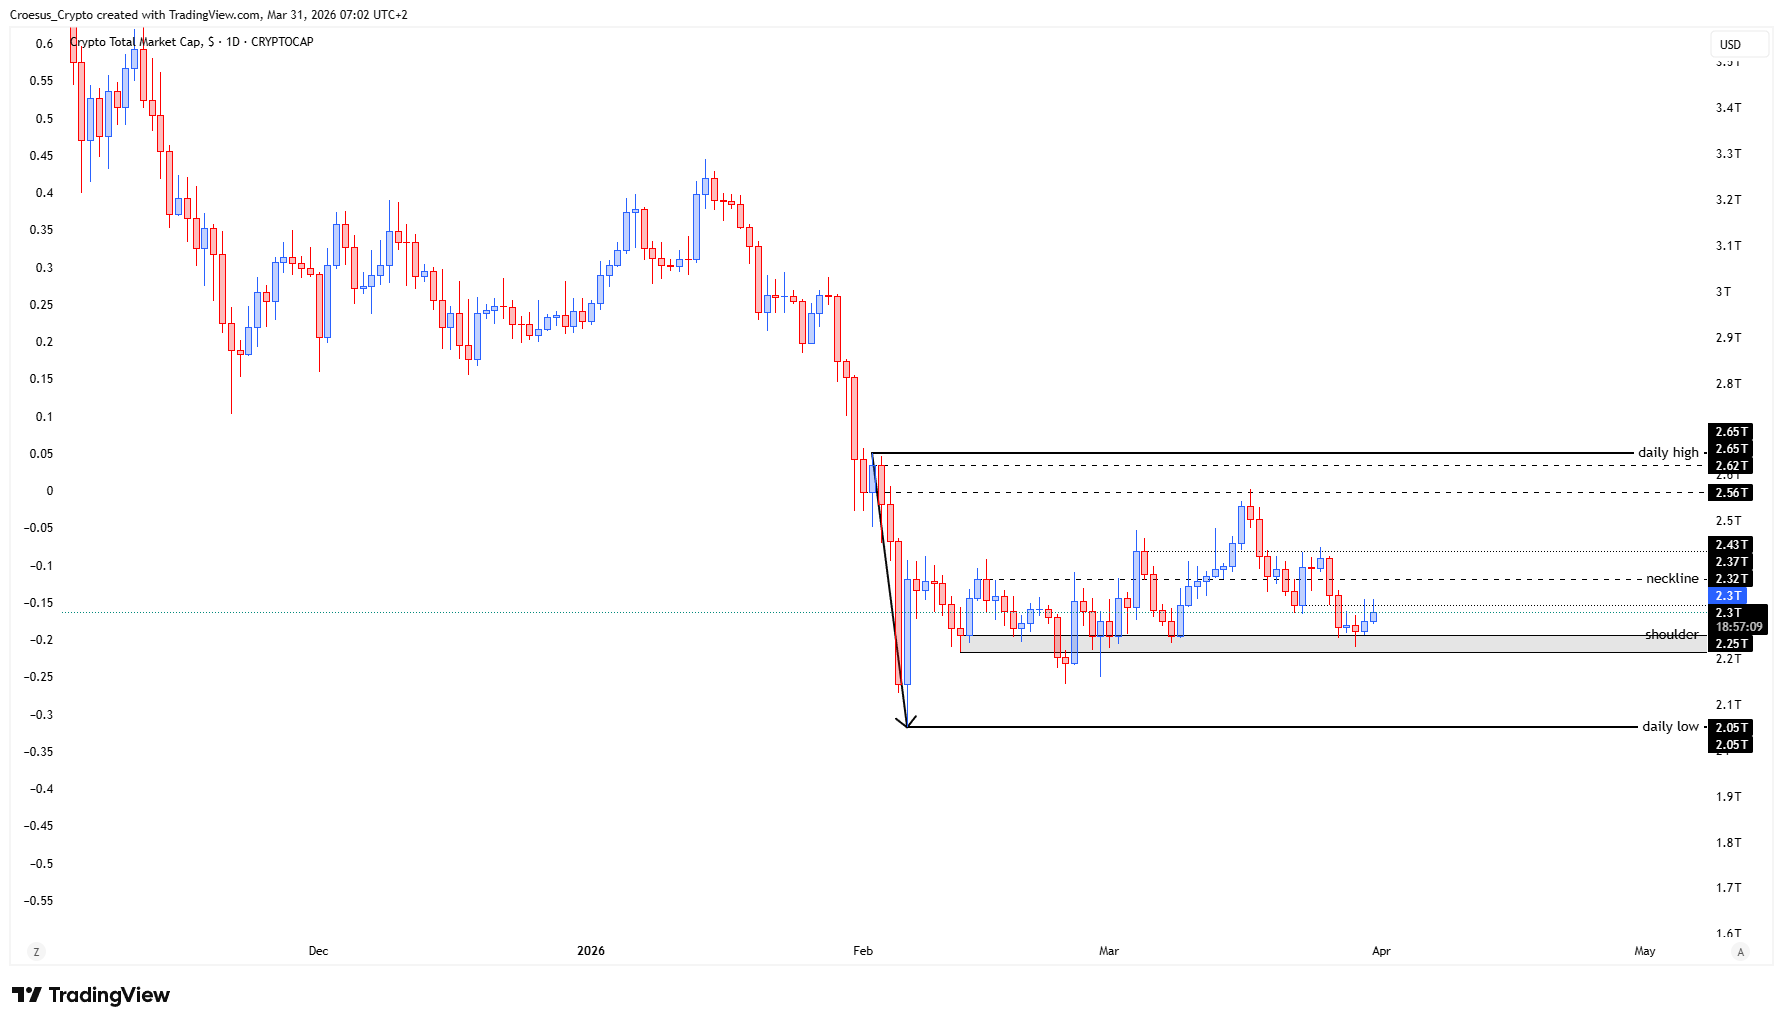
- The index shows a slightly bullish reaction upon touching the lower structures of the daily range
- At this moment we need to keep our mindset neutral and evaluate both directions.
- Bullish : we keep the shoulderlevel as support and attack the daily highs again, preferrably braking them
- Bearish : the inverse head and shoulder set-up has played out (-0.68 has been hit) and is no longer valid. At this moment there could be a head and shoulder forming where the prior iHS shoulder level becomes our current neckline and the 2.43T becomes our HS shoulderline. This means, in that case that we could see a slight push up until the 2.43T followed by a bearish reaction.
- As long as we don't any clear direction we have to remain very cautious in taking large positions.
Market Structure Analysis
From a market structure perspective, TOTAL daily analysis shows price responding at the range low, which often triggers a relief push into nearby resistance. However, the key structural issue is that the inverse head and shoulders is described as already “played out,” meaning that prior bullish continuation expectations are no longer the primary thesis. This shifts focus to whether the market is transitioning into a new distribution structure. If the prior iHS shoulder level is now behaving as a neckline, it becomes a critical support resistance reference: acceptance above it keeps the rebound alive, while failure to reclaim/hold it supports bearish continuation.
Key Levels and Scenarios
For the bullish scenario, TOTAL daily analysis needs the shoulder level to act as clean support and then a reclaim of the daily highs to confirm a break of structure. For the bearish scenario, a push toward the $2.43T area that fails and rejects would align with the proposed head and shoulders development and keep downside pressure intact.
- Lower structures of the daily range as the current demand zone driving the reaction
- Shoulderlevel as the key structural pivot (support if bullish, neckline reference if bearish)
- Daily highs as the break level required to confirm bullish continuation
- 2.43T as the potential head and shoulders shoulderline area and likely reaction zone
Trading Implications
With structure still transitional, our bias stays tactical: aggressive participation depends on clear confirmation (break of daily highs or clean rejection from the shoulder/neckline zone). Until direction is clear, risk management matters more than sizing, because both outcomes remain structurally plausible.
This analysis is for informational purposes only and does not constitute financial advice.