


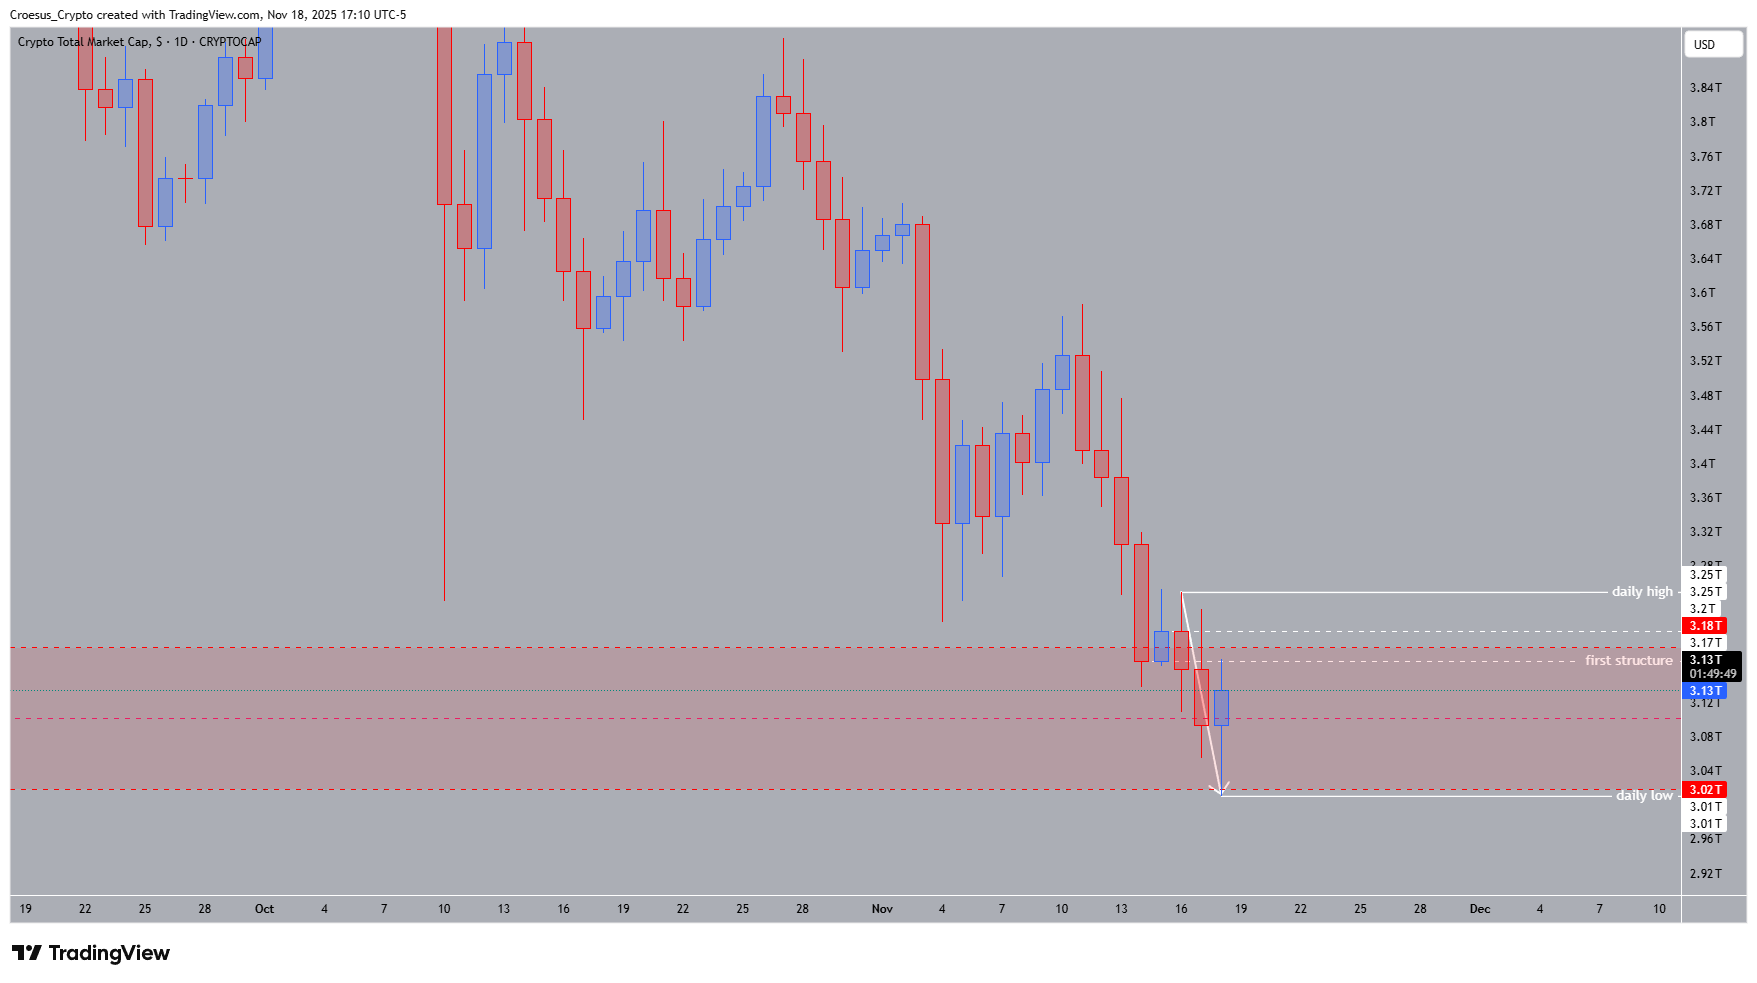
TOTAL daily analysis chart 2025-11-18 showing monthly key level, daily high/low and rejection at first structure
- Trend : bearish ↓
- Daily high : 3.25T
- Daily low : 3.01T
- Technical Analysis Key Points
- Today the index opened lower, swept the low of the monthly liquidity zone (monthly shoulder zone), and showed a bullish reaction.
- The index touched the first structure but got rejected again.
- As we are @ a monthly keylevel (the higher the timeframe the stronger the levels), we are looking for a reversal on the daily timeframe. We might see the start of a inverse head and shoulder, but until we see a break of structure of the daily high, we remain bearish. After a drop in the last two months of nearly 30%, I would to see a clear shift of momentum. Eventhough we expect a reversal at these keylevels, we still don't see any convincing switch of momentum. The last bullish candle of today is still smaller than the last bearish one.
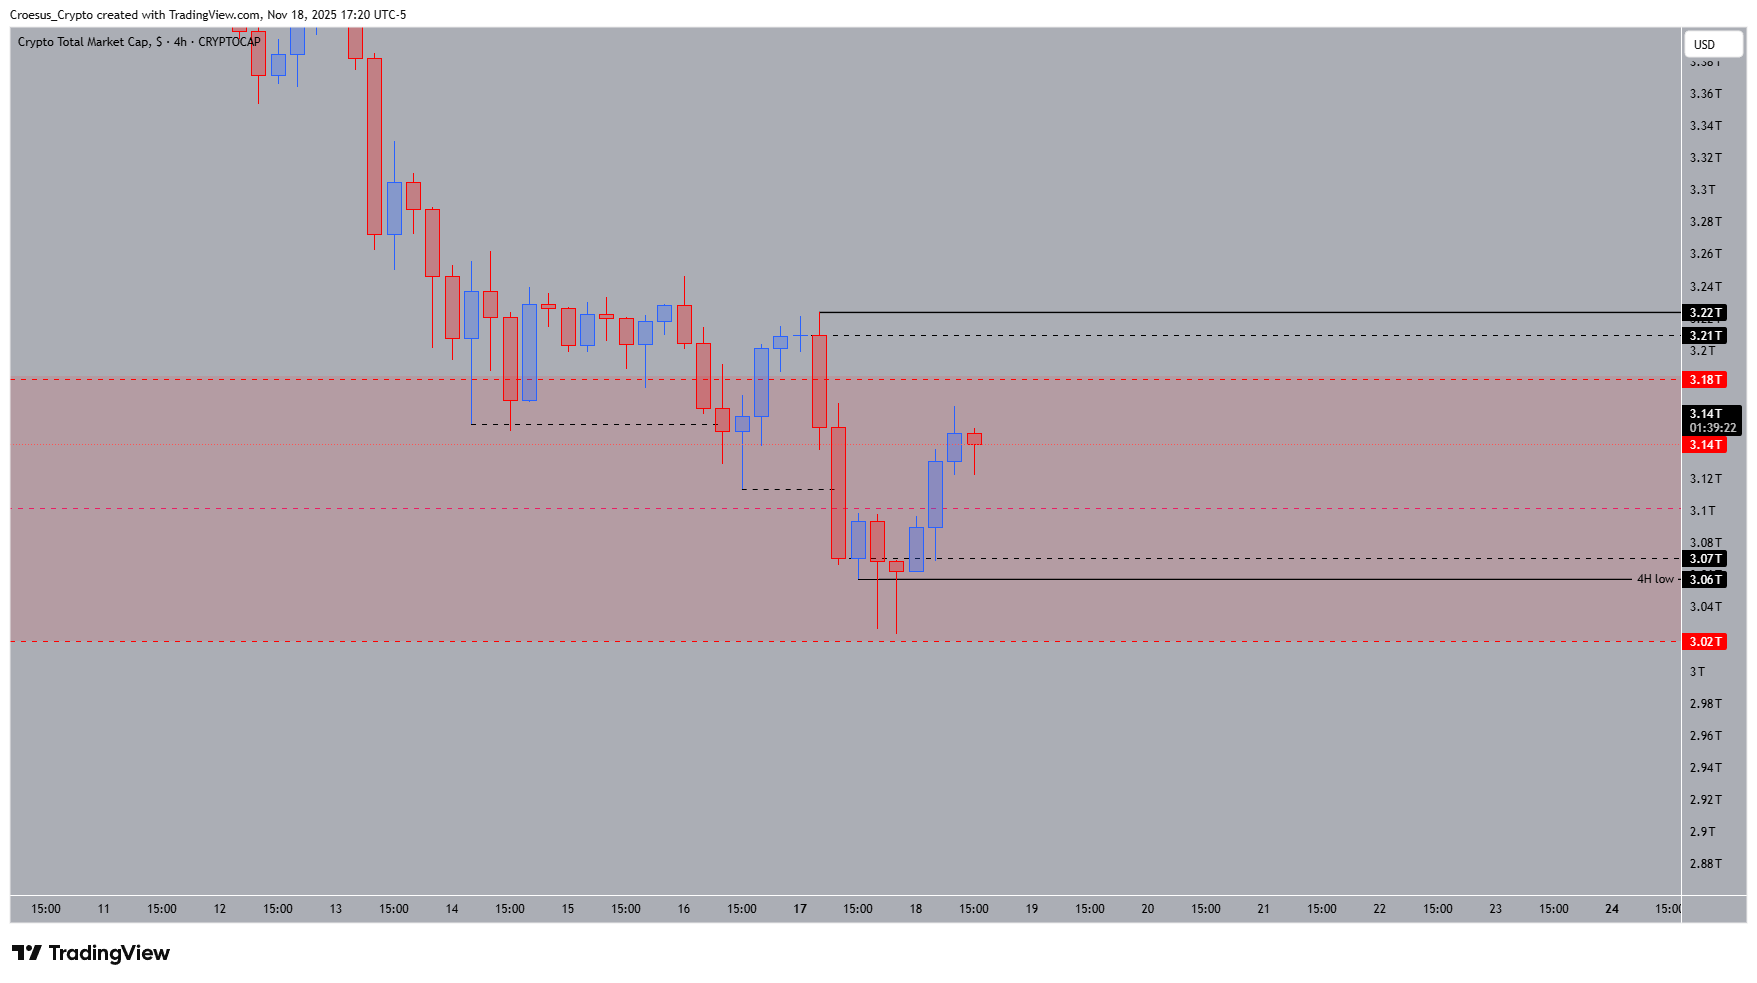
- If we look at the lower timeframe, the 4H timeframe we could notice a inverse head and shoulder pattern, where the bottom dashed line is the shoulder level. If we retest these levels, this would indicate that we might expect a double bottom on the daily chart, which is still a perfectly valid pattern.
- Patience is key ! Wait for confirmation !
TOTAL 4H analysis chart 2025-11-18 showing inverse head and shoulder structure and shoulder retest zone
Market Structure Analysis
Our TOTAL daily timeframe analysis shows the market reacting at a significant monthly liquidity zone after sweeping the lower boundary. This aligns with classic reversal behavior at high-timeframe support, yet the broader technical analysis still reflects bearish structure until the market reclaims the daily high at 3.25T. The recent bounce stalled at the first structure, underlining continued supply pressure.
On the 4H chart, the developing inverse head and shoulder pattern provides an early structural clue. A retest of the shoulder zone could form a daily double bottom—still a valid bullish reversal pattern—but without a daily break of structure, momentum remains bearish. The lack of strong bullish candle follow-through confirms hesitation from buyers.
Key Levels and Scenarios
Bullish scenario:
A confirmed break above 3.25T (daily high) would signal a momentum shift and open room toward 3.18T → 3.25T retracement followed by broader recovery targets.
Critical levels to watch:
3.01T (daily low): Must hold to sustain reversal potential
3.07T: 4H shoulder support, key retest zone
3.15T: First structure resistance
3.18T: Daily mid-range resistance
3.25T: Break of structure trigger
Disclaimer: This analysis is for informational purposes only and is not financial advice.