


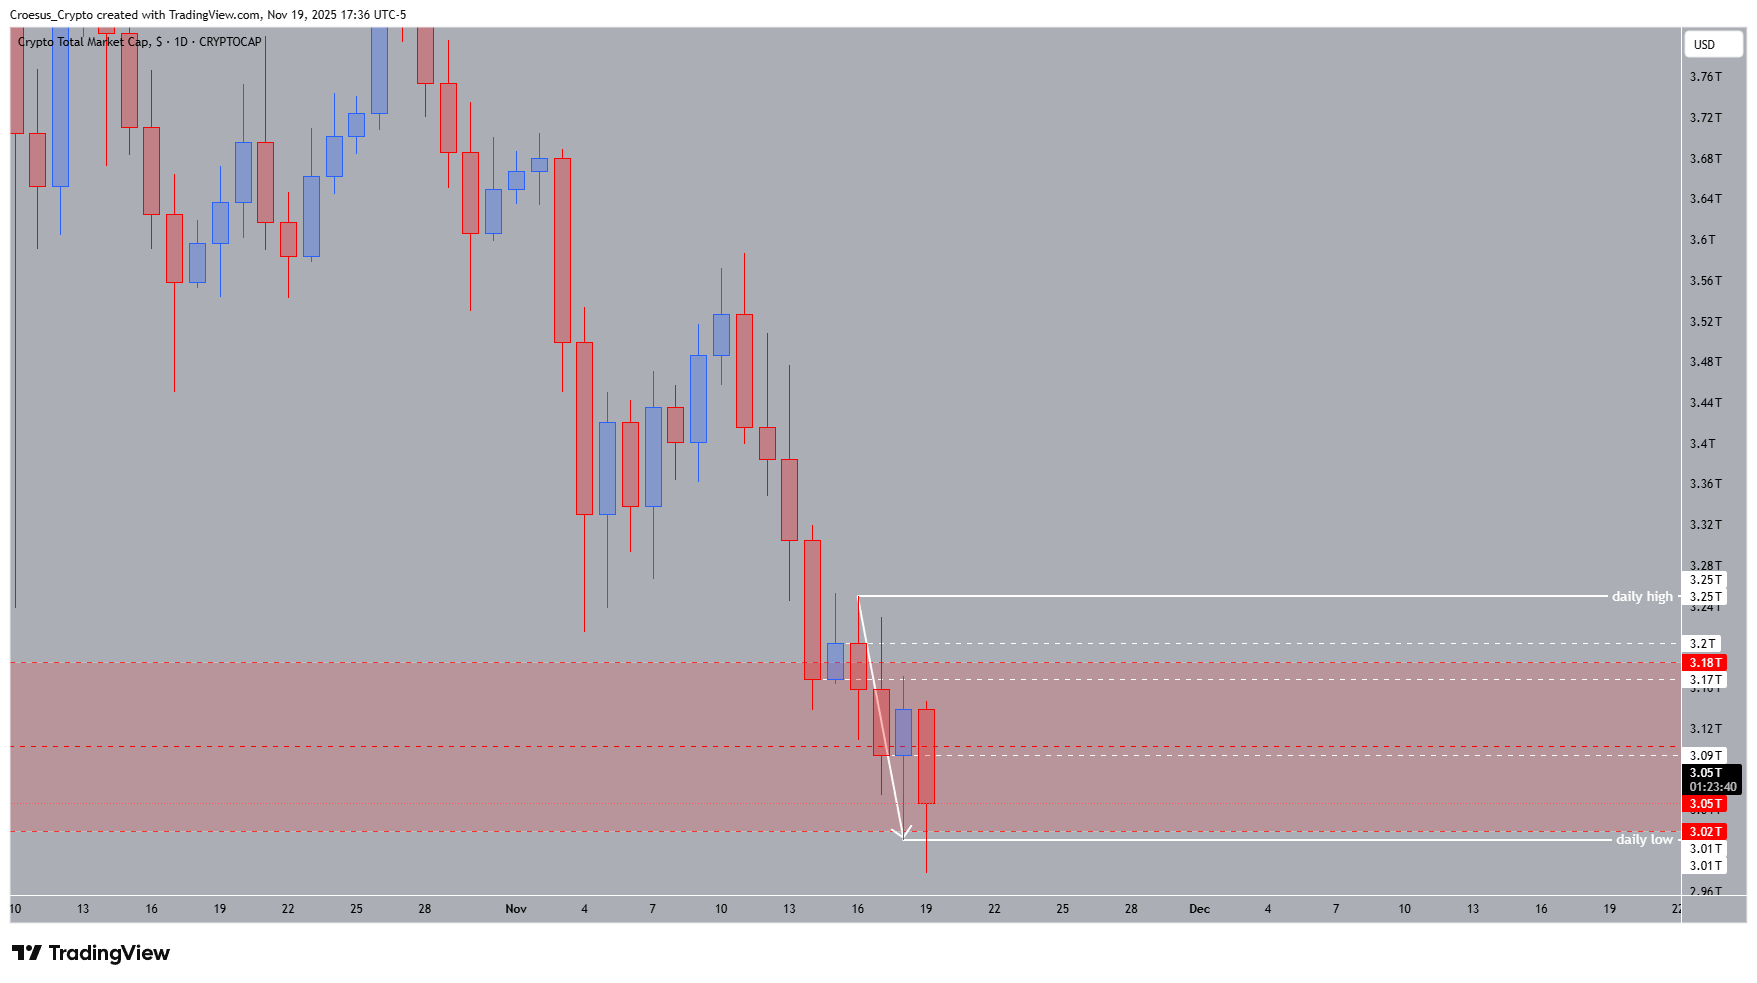
TOTAL daily chart 2025-11-19 with liquidity zone, daily high 3.25T and daily low 3.01T
- Trend : bearish ↓
- Daily high : 3.25T
- Daily low : 3.01T
- Technical Analysis Key Points
- After being rejected at the prior low, the bears kicked back in today, retesting the daily low and the low of the monthly liquidity zone.
- After the sweep of those lows, the index managed to close back above the lows.
- As we are @ a monthly keylevel (the higher the timeframe the stronger the levels), we are looking for a reversal on the daily timeframe. We might see the start of a inverse head and shoulder, but until we see a break of structure of the daily high, we remain bearish. After a drop in the last two months of nearly 30%, I would to see a clear shift of momentum. Eventhough we expect a reversal at these keylevels, we still don't see any convincing switch of momentum. The last bearish candle is still bigger than the last bullish one.
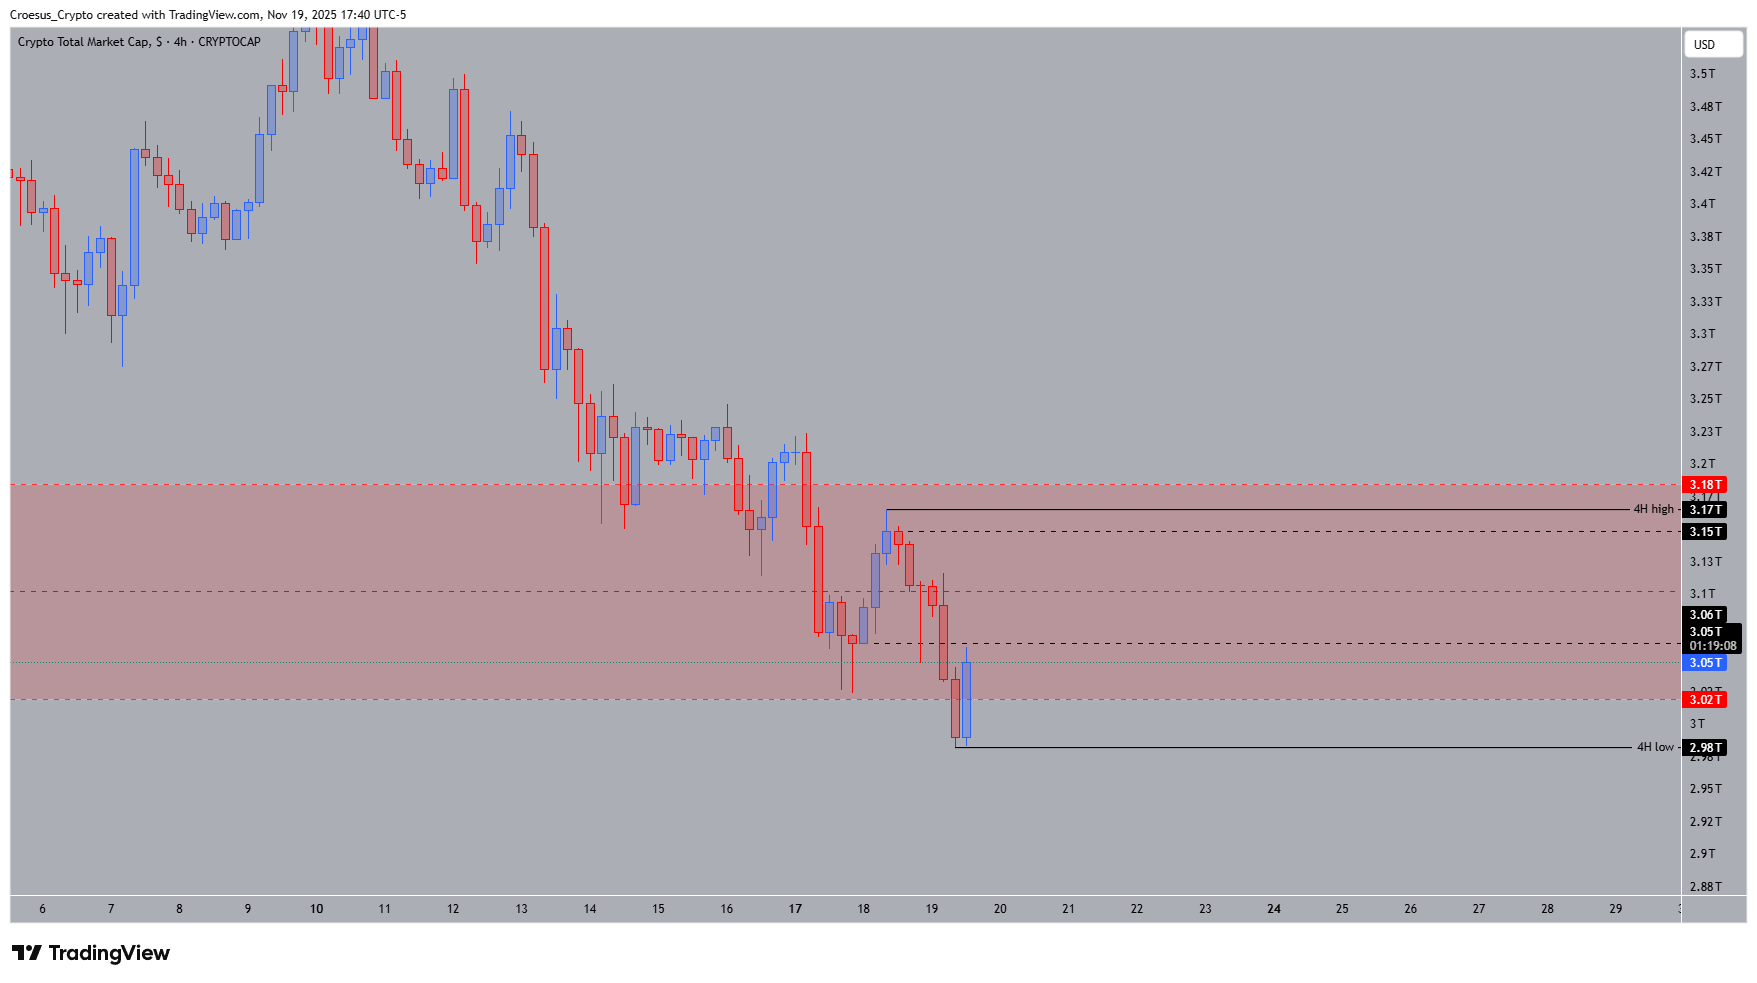
- If we zoom in on the 4H timeframe, we still remain bearish, printing a new lower low. We pushed briefly past the low of the monthly liquidity zone, but reclaimed that level on the following candle.
- But still no signs of reversal. Patience remains key ! Wait for confirmation !
TOTAL 4H chart 2025-11-19 with lower-low structure and liquidity sweep reclaim
Market Structure Analysis
The TOTAL marketcap continues to print a clean bearish structure on the daily chart, reinforcing the current downward trend. Price tapped the monthly liquidity zone and swept the 3.01T daily low before closing back above it, signaling that liquidity has been taken but not yet reversed. The potential inverse head and shoulders pattern mentioned in the input would only activate with a decisive break of structure above the 3.25T daily high, which currently remains unviolated.
Despite the sweep, bearish control is still visible: the most recent red candle dominates the last bullish attempt, confirming no momentum shift. On the 4H chart, the new lower low strengthens the downtrend, even though the reclaim of the liquidity zone hints at possible absorption. Still, this qualifies only as reaction—NOT confirmation. Without higher-timeframe validation, the trend bias stays bearish.
Key Levels and Scenarios
Bullish scenario (requires confirmation)
A bullish reversal begins only with a break and close above 3.25T (daily high). That would confirm structure break and open room toward the mid-range 3.30T–3.35T zone (+2–4%).
Critical levels to watch:
3.25T – Daily high: Break of structure required for reversal
3.18T – Mid-range resistance: First reaction zone on any bounce
3.05T – Intraday support: First level that must hold to avoid deeper downside
3.01T – Daily low: Key liquidity floor; sweep already occurred
2.98T – 4H low: Failure here exposes deeper continuation
3.25T: Break of structure trigger
Disclaimer: This analysis is for informational purposes only and is not financial advice.