


In this TOTAL daily analysis for late November 2025 we look at a potential ABC corrective move after an extended bearish leg. Our technical analysis follows the Croesus “naked trading” methodology with clean price action, support resistance and Fibonacci focus.
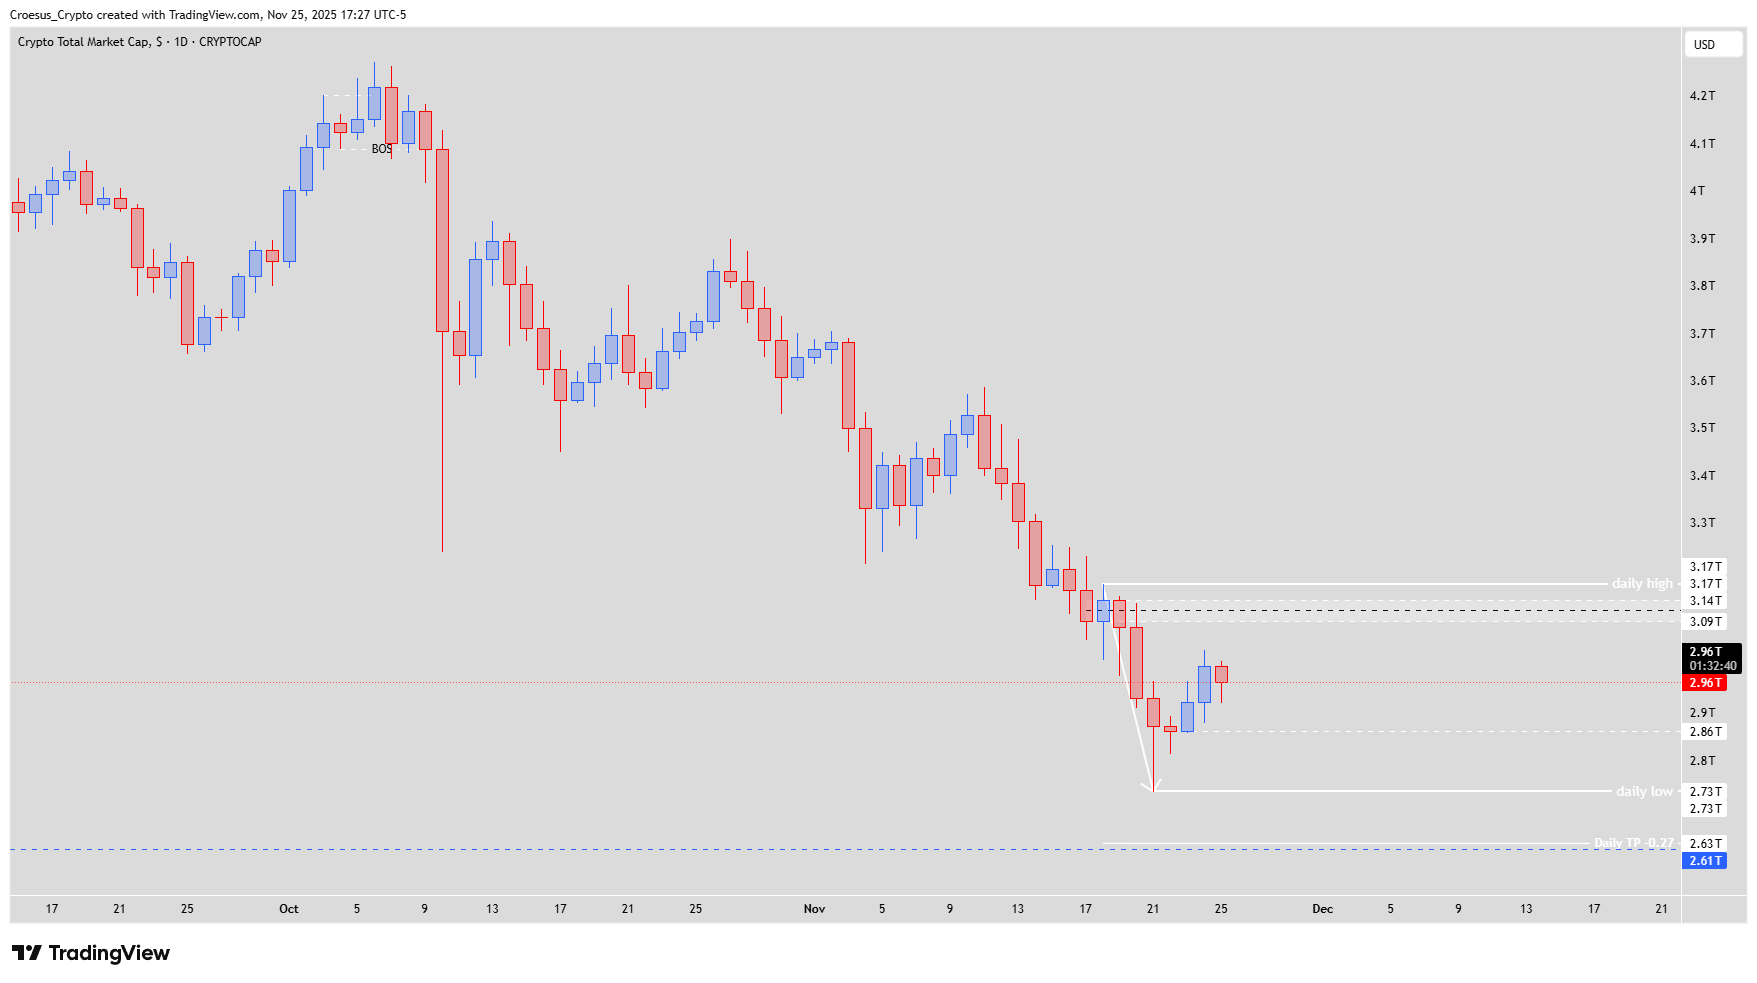
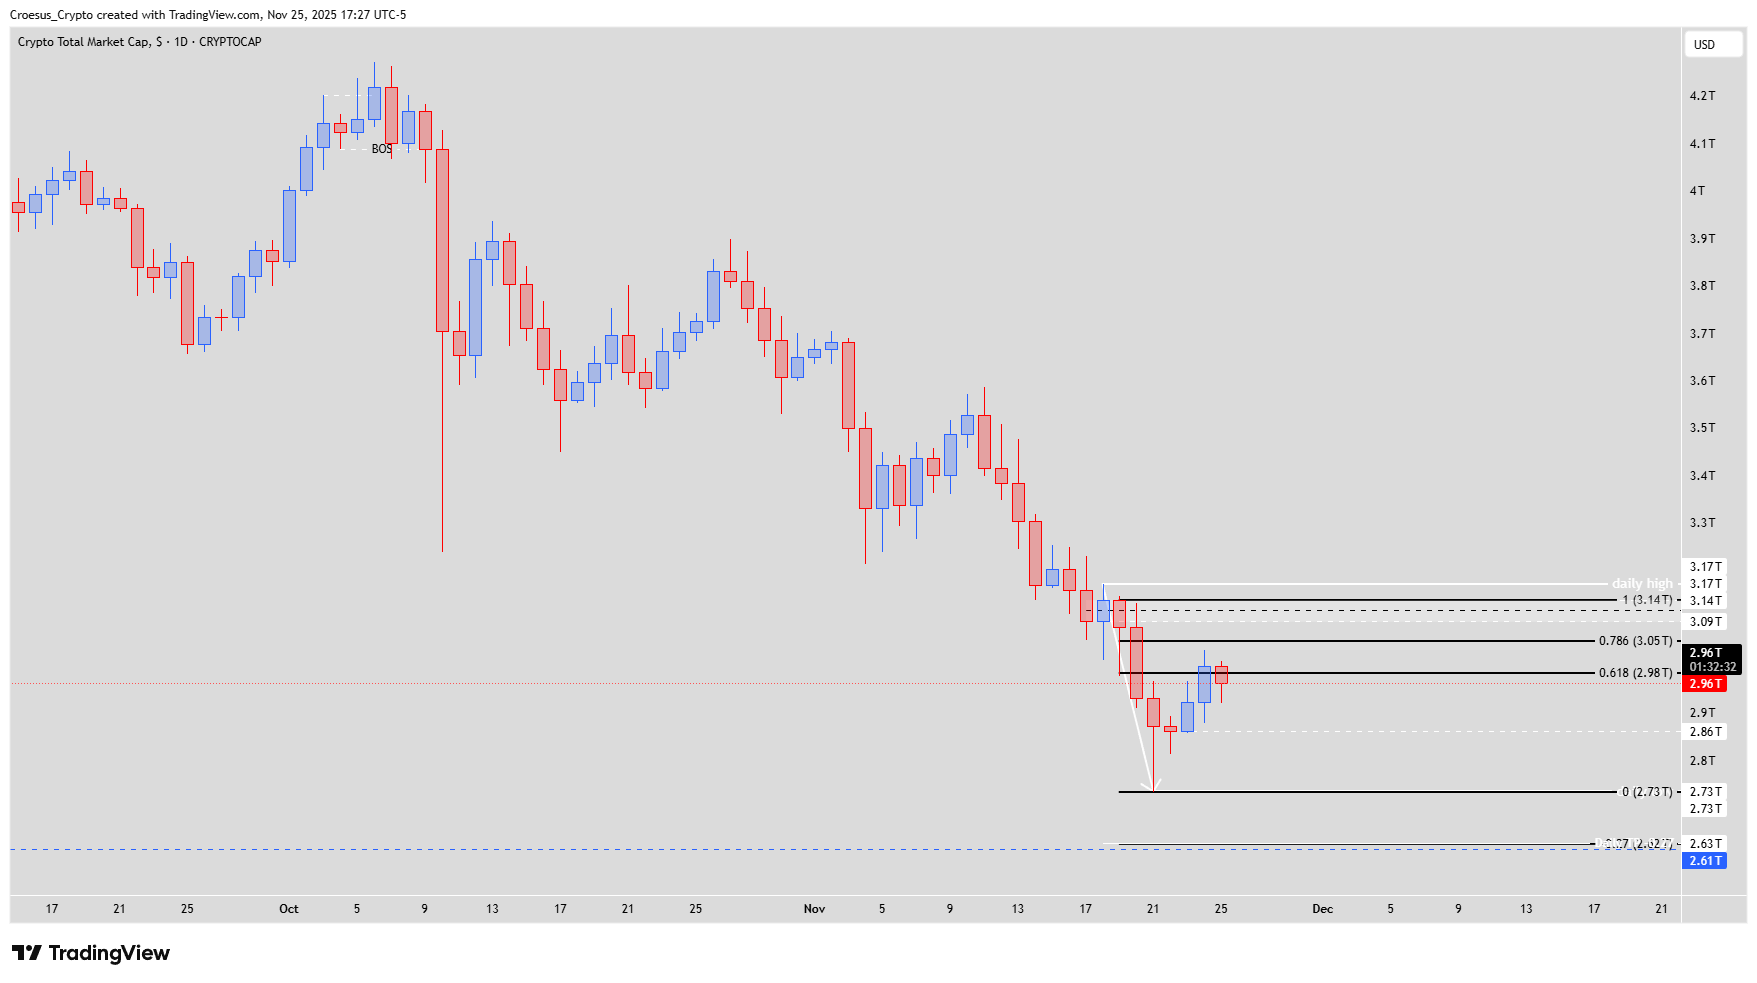
TOTAL daily chart 25 Nov 2025 with Fibonacci retracement, 0.618 tap and 3T golden zone.
Trend = bearish
Technical Analysis Key Points
- Today the index printed a bearish candle after two bullish candles. This would fit in our analysis that we expect a bullish relief rallye until 3T, but to initiate a bearish continuation.
- This might be a ABC correction of the bearish leg down. If we take the fib retracement of this smaller corrective bullish leg up, we can see that the bearish candle just touched the fib 0.618.
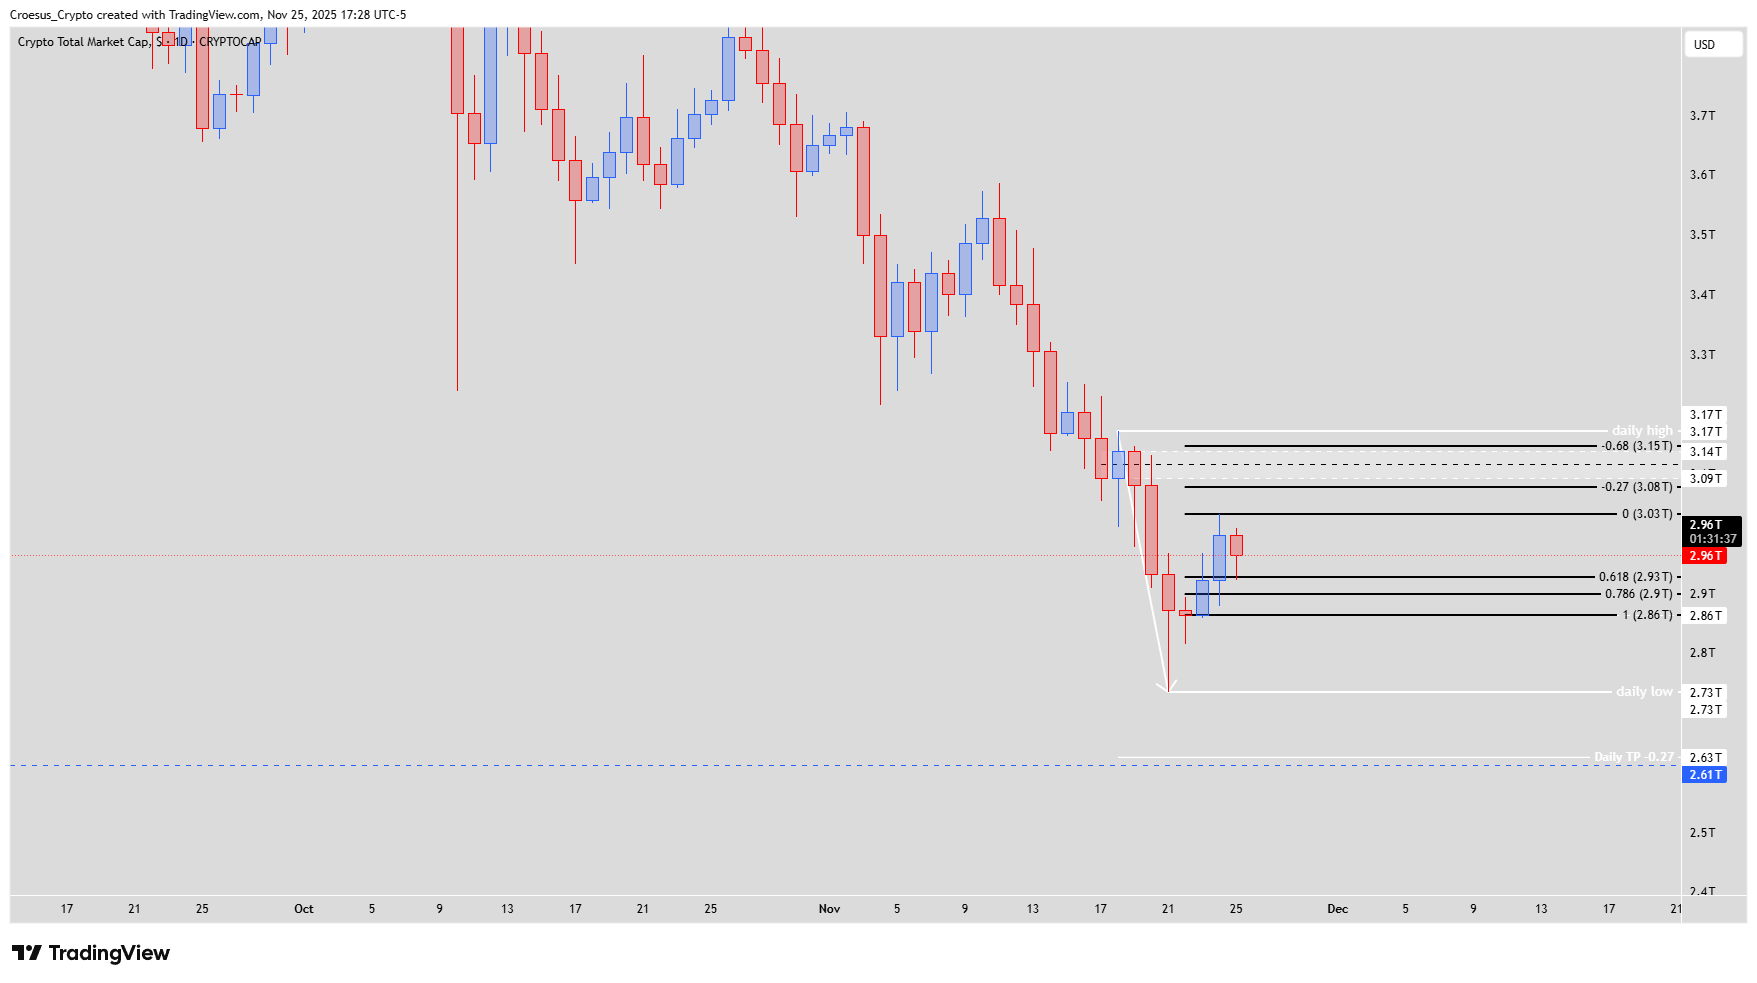
- Tomorrow we still might see a further push down or not, but the daily entry zone around 3T is perfectly situated in the golden zone between fib completion -0.27 and -0.68 (chart 3).
- This would fit in our analysis that we expect a bullish relief rallye until 3T, but to initiate a bearish continuation.
- In order to get a bullish bias the index needs to break and close above the daily high @3.17T.
- At this moment our bias is still bearish : bullish correction until the first structure @ 3.09T followed by a bearish continuation to the 2.63 T. This level is confluent with the weekly shoulder level @ 2.61T.
Market Structure Analysis
Our TOTAL daily analysis currently treats the recent two-candle bounce as a smaller corrective leg within the dominant downtrend. The fresh bearish candle off the local high confirms supply stepping in and respects the 0.618 Fibonacci retracement of that corrective upswing, a classical reaction area in technical analysis.
Price is gravitating around the 3T area, where the daily entry zone overlaps with the Fibonacci completion band between -0.27 and -0.68. This confluence forms a key resistance / “golden zone” in our support resistance map. As long as candles fail to close above the prior daily high at 3.17T, we view this as a relief rally inside a broader bearish structure.
Key Levels and Scenarios
A short-term bullish scenario remains possible via a relief move into 3.0–3.09T (first structure) and potentially a liquidity grab toward 3.17T. Only a strong break and close above 3.17T would flip our bias to constructive. Otherwise we anticipate the corrective leg to complete and the larger bearish continuation to resume.
Key levels to watch:
3.17T – Daily high: break-and-close needed for a genuine bullish bias shift.
3.09T – First structure: ideal zone for the bullish correction to exhaust.
3.0T area – Daily entry / golden zone: main resistance cluster from Fibonacci completion.
2.63T – Downside target: projected continuation level.
2.61T – Weekly shoulder: higher-timeframe support aligned with the 2.63T target.
Trading Implications
Within this TOTAL daily analysis we see best reward-to-risk for bears patiently stalking signs of exhaustion between 3.0T and 3.09T, with invalidation above 3.17T and potential swing targets into 2.63T / 2.61T; position sizing should respect individual risk plans and volatility.
This content is for educational purposes only and is not financial advice; always do your own research before making any investment or trading decisions.