


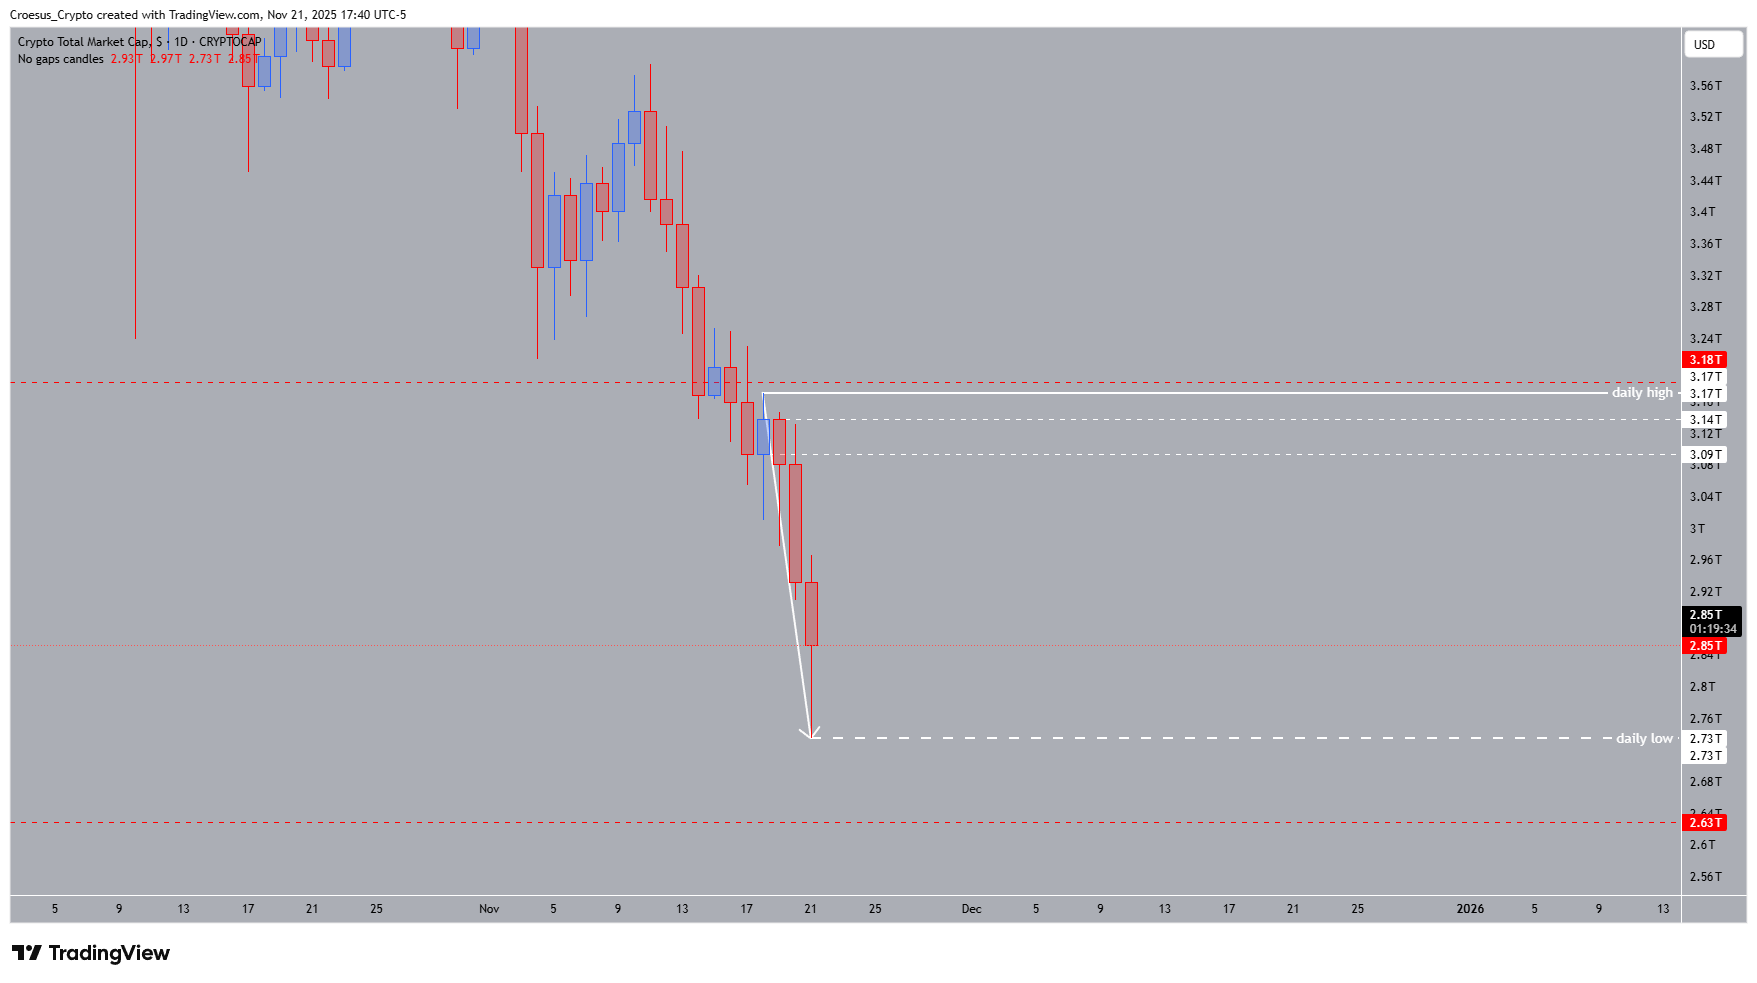
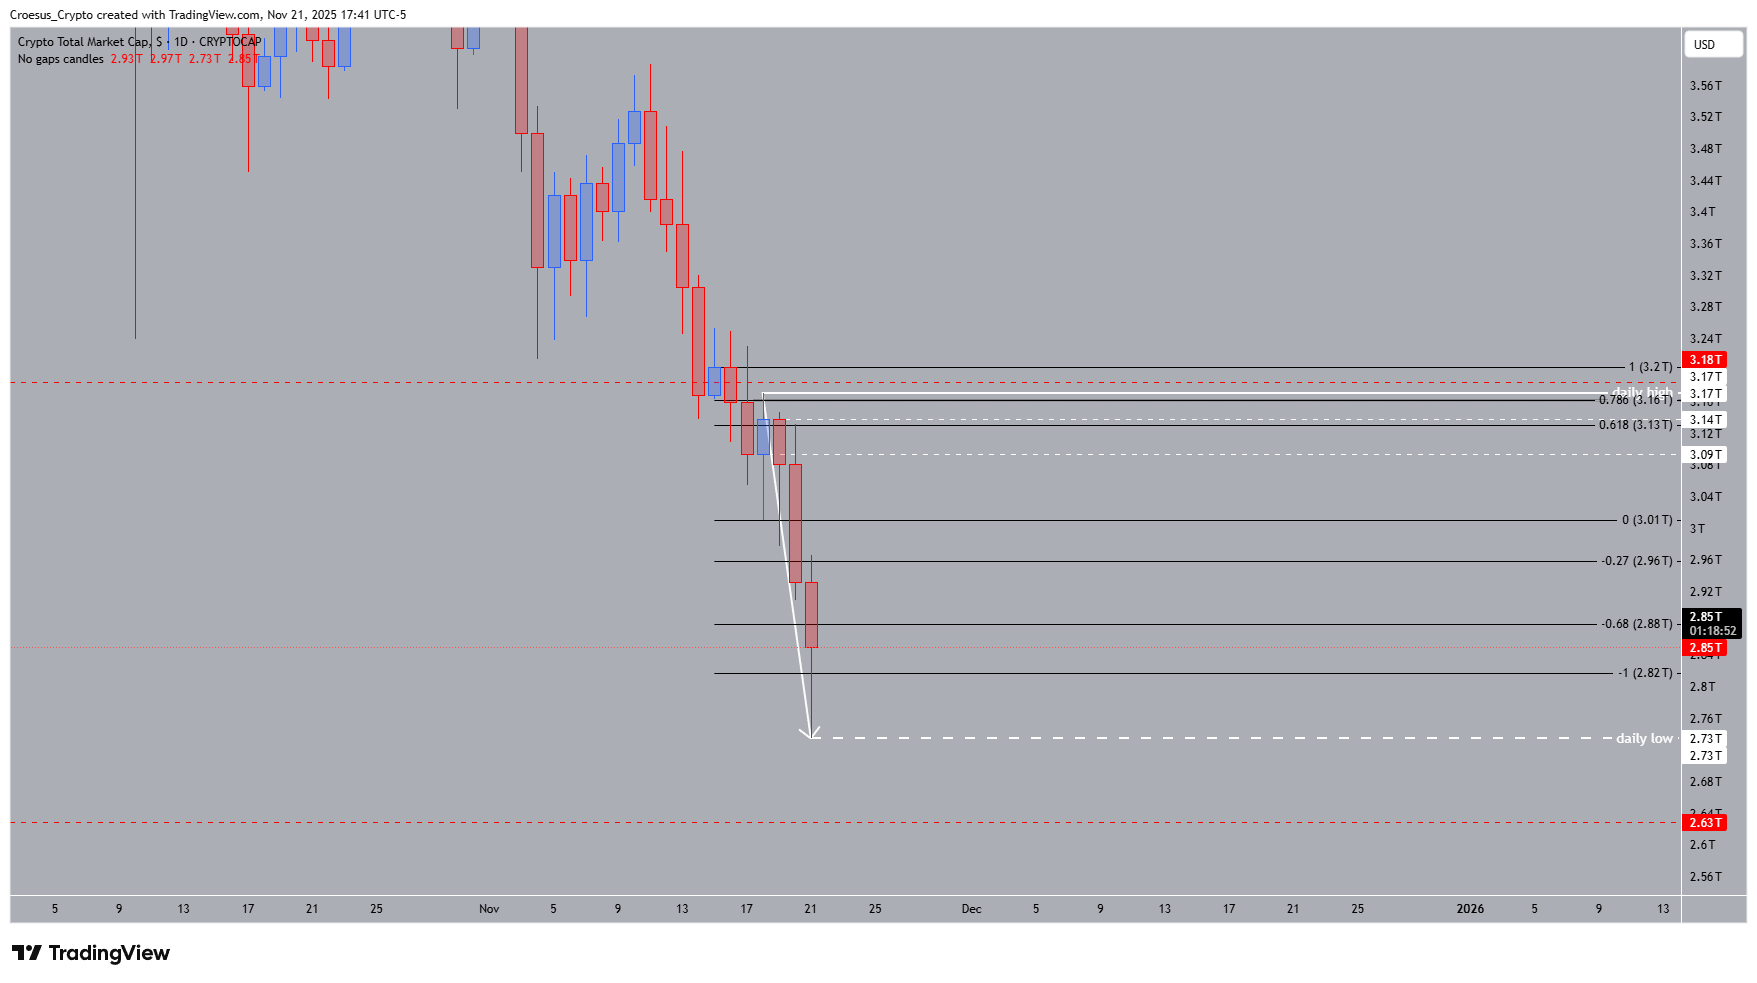
TOTAL daily chart 2025-11-21 with bearish continuation, liquidity sweep, and intraday relief rally
- Trend : bearish ↓
- Daily high : 3.17T
- Daily low : 2.73T (non confirmed)
- Technical Analysis Key Points
- After the break of the daily low yesterday we saw bearish continuation today printing an unconfirmed low @ 2.73T
- The index made the fib completion -1, showing us that we might see some relief direction 3T.
- A further push down to the monthly key level 2.63T is possible
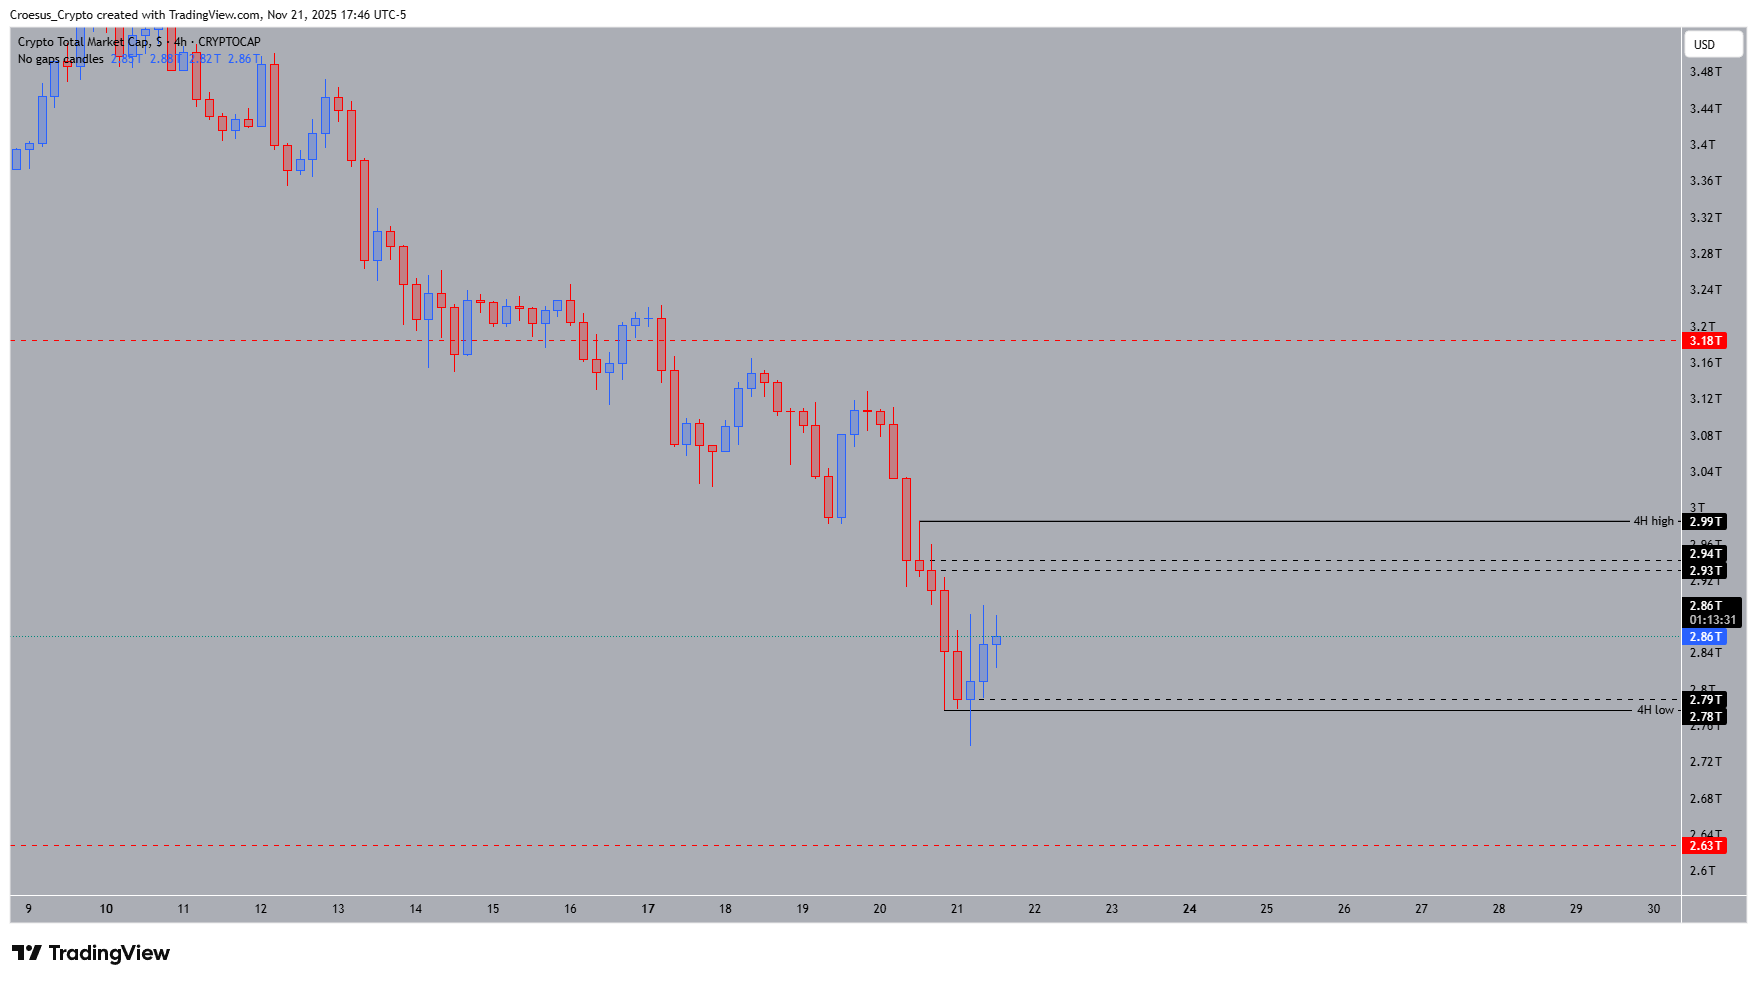
- If we zoom in on the 4H timeframe, we still remain bearish. We started the day with a liquidity sweep in both direction and started a relief rallye today
- But still no signs of reversal. Patience remains key ! Wait for confirmation !
TOTAL 4H chart 2025-11-19 with lower-low structure and liquidity sweep reclaim
Market Structure Analysis
Our TOTAL daily timeframe analysis continues to show dominant bearish structure. The break and close below the previous daily low confirmed continuation, aligning with the overall downside trend. Price extended smoothly into the Fib -1 completion, a common exhaustion region, which often triggers short-term relief bounces. This aligns with the potential retrace toward the 3T handle, sitting just below the daily imbalance zone and the mid-range between the prior swing high and the new unconfirmed low.
On higher timeframes, a clean support cluster remains at the 2.63T monthly key level, a historically defended zone. If bearish momentum persists, this becomes the next major liquidity target. Meanwhile, the 4H chart shows a liquidity sweep on both sides of the intraday range earlier today, followed by a relief rally — yet the structure remains fully bearish with no confirmed reversal pattern in sight.
Key Levels and Scenarios
Bullish scenario (temporary relief):
A relief move becomes viable only if price reclaims 2.93T with momentum. This could open the door toward the 3T zone (+4–5%), aligned with the Fib retracement cluster.
Critical levels to watch:
3.17T (Daily high): Key invalidation area for deeper downside
3T: First relief target aligned with Fib confluence
2.93T: Mid-range acceptance required for meaningful bounce
2.73T (Daily low – unconfirmed): Must hold to avoid further downside
2.63T: Major monthly support and next liquidity target
Trading Implications
Market remains bearish; any long exposure should be sized conservatively, with confirmation required before entry and stops placed below the unconfirmed low to avoid catching a falling knife.
3.25T: Break of structure trigger
Disclaimer: This analysis is for informational purposes only and is not financial advice.