


This TOTAL daily analysis for November 2025 focuses on the crypto total market cap after the recent Fibonacci -0.68 completion and sharp bounce. Our technical analysis still treats the current move as a corrective rally within a broader bearish structure.
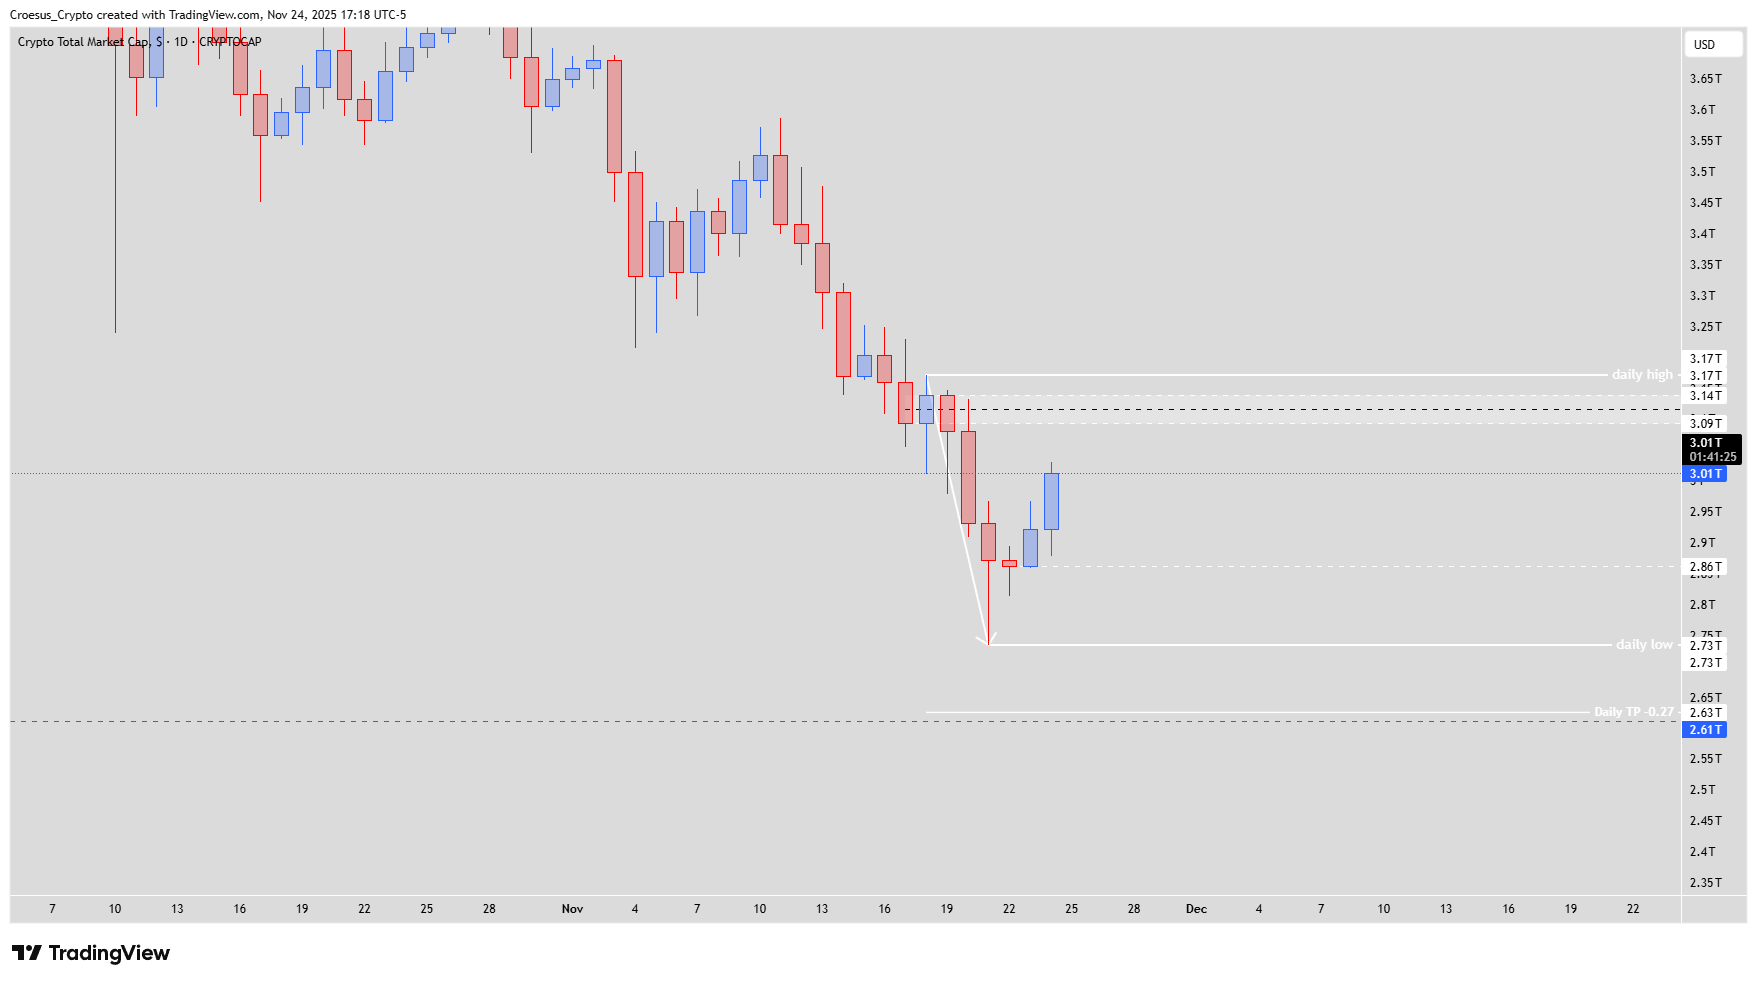
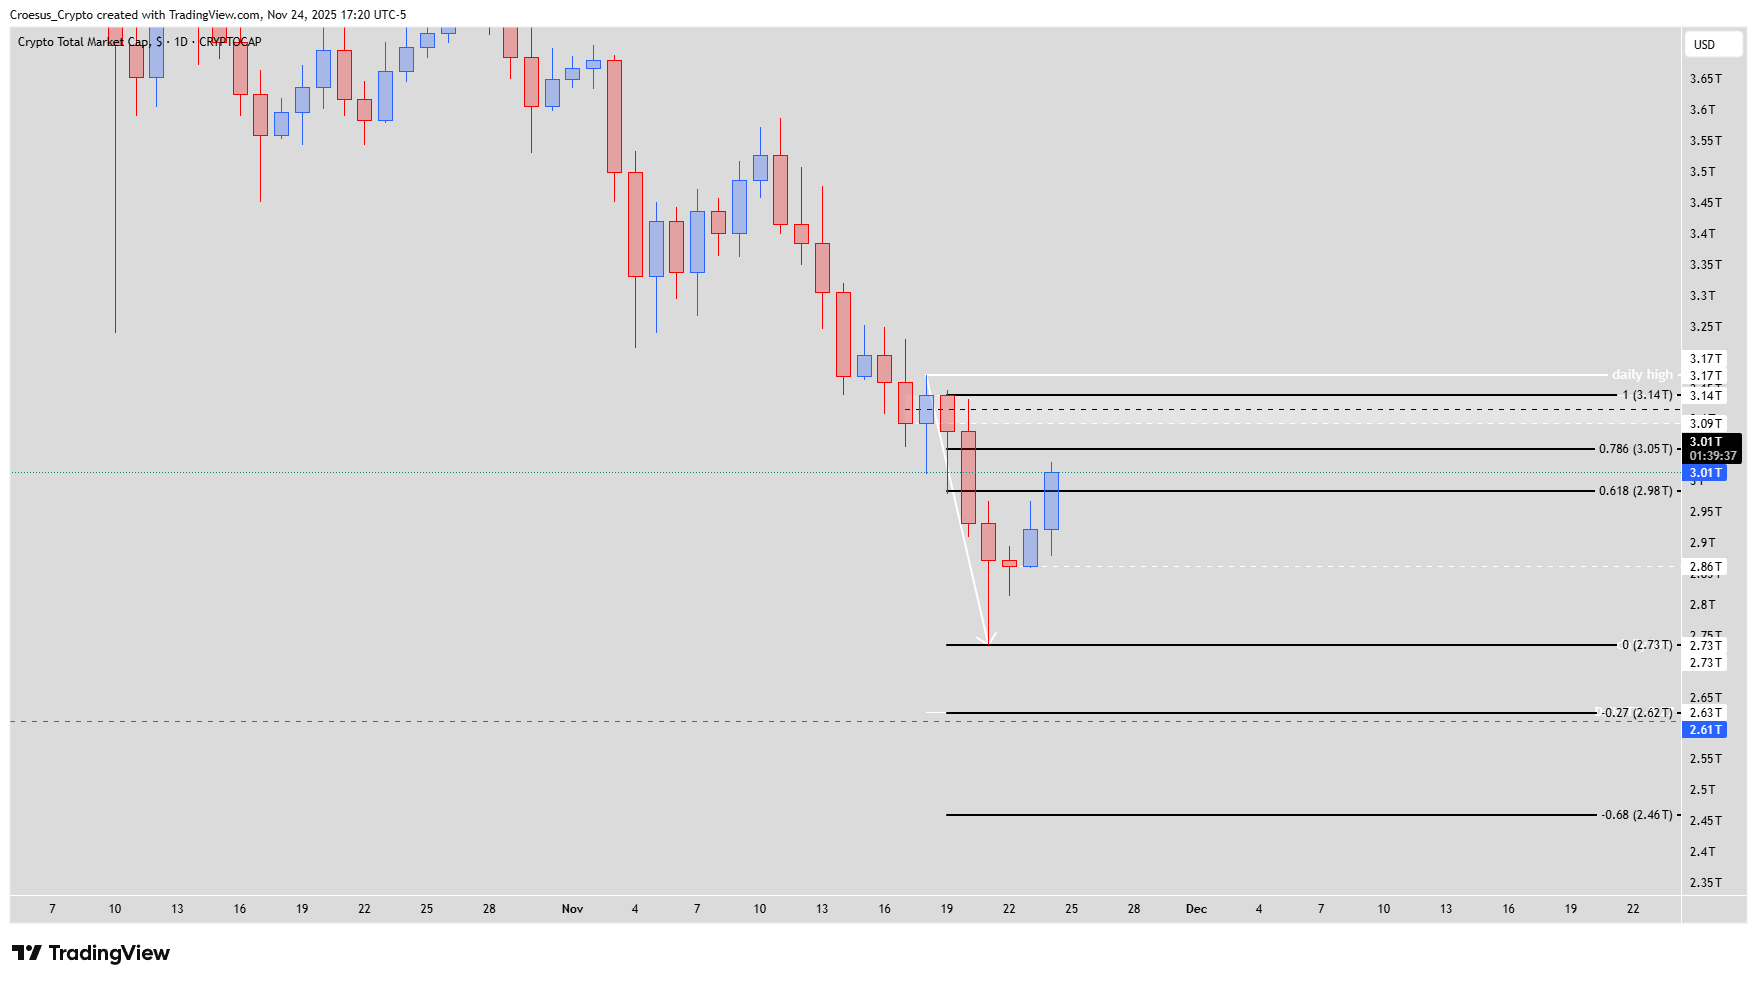
TOTAL daily chart November 24 2025 with Fibonacci -0.68 completion, corrective bounce toward 3.09T–3.17T and support near 2.63T–2.61T.and intraday relief rally
Trend = bearish
Technical Analysis Key Points
- Technical Analysis Key Points
- The bearish impuls hit the fib completion -0.68 so this weekend the index bottomed out and reversed. Today we saw some further bullish continuation.
- Take note : at this moment the index is still in a bearish downtrend. This bullish relief rallye is at this moment nothing more than a corrective move.
- In order to get a bullish bias the index needs to break the daily high @3.17T.
- At this moment our bias is still bearish : bullish correction until the first structure @ 3.09T followed by a bearish continuation to the 2.63 T. This level is confluent with the weekly shoulder level @ 2.61T.
Market Structure Analysis
The impulsive leg down has exhausted at the Fibonacci -0.68 extension, where buyers stepped in and formed a local bottom. Since then, price has pushed higher in a clean relief rally, but the broader market structure remains one of lower lows and lower highs. As long as TOTAL trades below the prior daily high at 3.17T, we treat this move as corrective, not as the start of a new bullish trend.
The first meaningful resistance / structure zone sits around 3.09T, where previous breakdown levels now act as potential support resistance. On the downside, the main bearish target remains the 2.63T area, aligning closely with the weekly shoulder support around 2.61T, creating a strong confluence zone should sellers regain control.
Key Levels and Scenarios
Bullish scenario: only a decisive break and hold above the 3.17T daily high would shift our bias to bullish and suggest the corrective structure has evolved into a larger trend reversal.
3.17T – Daily high that must break to flip bias bullish.
3.09T – First structure / resistance for the current relief rally.
2.63T – Primary downside target for renewed bearish continuation.
2.61T – Weekly shoulder support, confluent with the 2.63T target zone.
Fibonacci -0.68 completion – Local bottom and origin of the ongoing corrective bounce.
Trading Implications
For now, our analysis favors fading strength into the 3.09T–3.17T region while the trend is down, with invalidation above 3.17T and downside focus toward 2.63T–2.61T; aggressive longs are only justified once price reclaims and defends the daily high.
Disclaimer: This analysis is for informational purposes only and is not financial advice.