TOTAL Marketcap / Crypto Total Market Cap
TOTAL daily analysis 23-04-2026. The total crypto market cap is stalling at a key inflection area, and current price action reads as indecision near the daily highs while the broader bias remains bearish until proven otherwise.
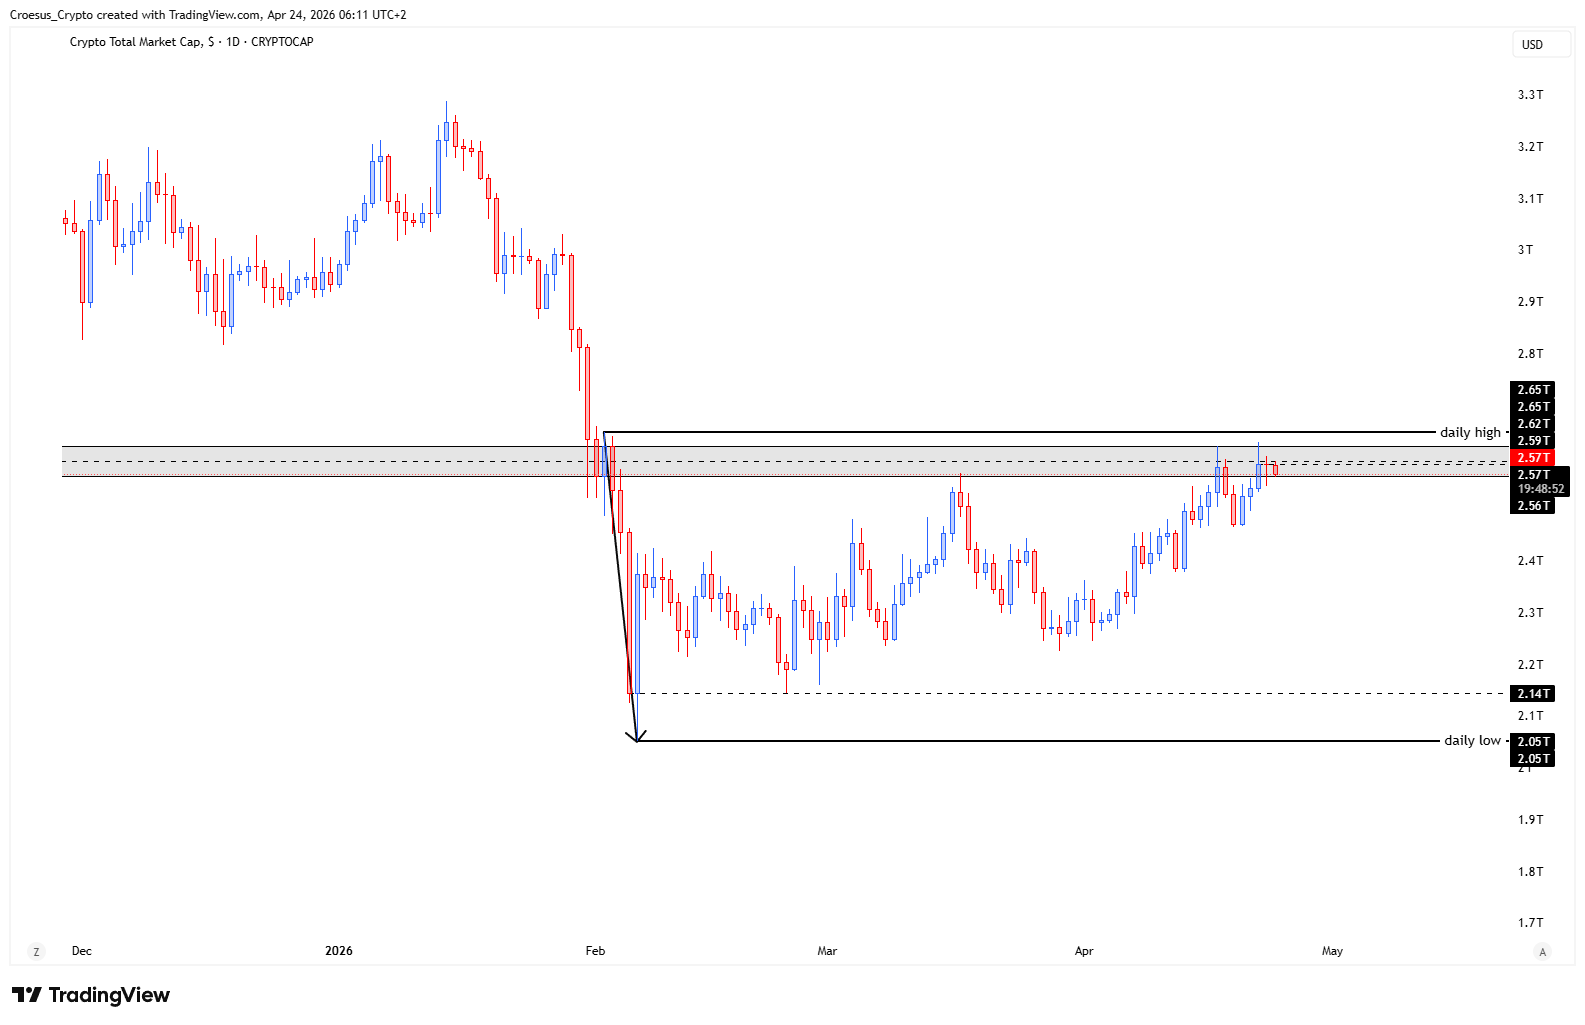
- TOTAL can not decide yet : will we break the daily highs and continue pushing higher or do we take some relief and do we see some bearish action ?
- This is an key level : do we see that break and hold above the daily high or do we see a bearish move back into the range ?
Market Structure Analysis
From a naked trading perspective, our TOTAL daily analysis focuses on whether current compression near the daily highs resolves as continuation or rejection. When price can not decide at a range boundary, the market is typically sitting in a liquidity zone: breakout traders are positioned above the daily high, while sellers defend that level to force a move back into the prior range. Structurally, the bearish read stays valid if the market fails to accept above the daily high (a wick/quick rejection) and rotates back into the range, signalling the prior swing structure is still controlling. Conversely, a clean break and hold above the daily high would be an acceptance move that shifts short-term structure and can open room for a broader relief push, even if the higher-level trend remains heavy.

Key Levels and Scenarios
In this TOTAL daily analysis, the trigger is acceptance versus rejection at the daily high. Bullish continuation needs a break and sustained hold above that high; bearish continuation shows up as failure to hold the breakout, followed by a rotation back into the range and a move toward deeper range support.
- Daily high: primary breakout/acceptance level that must break and hold for upside continuation
- Range high: immediate resistance zone where rejection can signal a return to rotation
- Range midpoint: typical reaction area if price slips back into the range
- Range low: structural support where bearish continuation can target if downside momentum expands
Trading Implications
Aggressive traders typically treat this as a decision-node environment: either trading the acceptance above the daily high, or fading a failed breakout back into the range. Conservative traders usually wait for confirmation (hold above resistance or a clear break back into range) because chop around range boundaries can invalidate early entries quickly.
This analysis is for informational purposes only and does not constitute financial advice.