

TOTAL Marketcap / Crypto Total Market Cap
TOTAL monthly analysis Janaury 2026. The total crypto market cap is trading back at a historically important horizontal zone after a full retracement, and the latest monthly close signals active defense from buyers at this level.
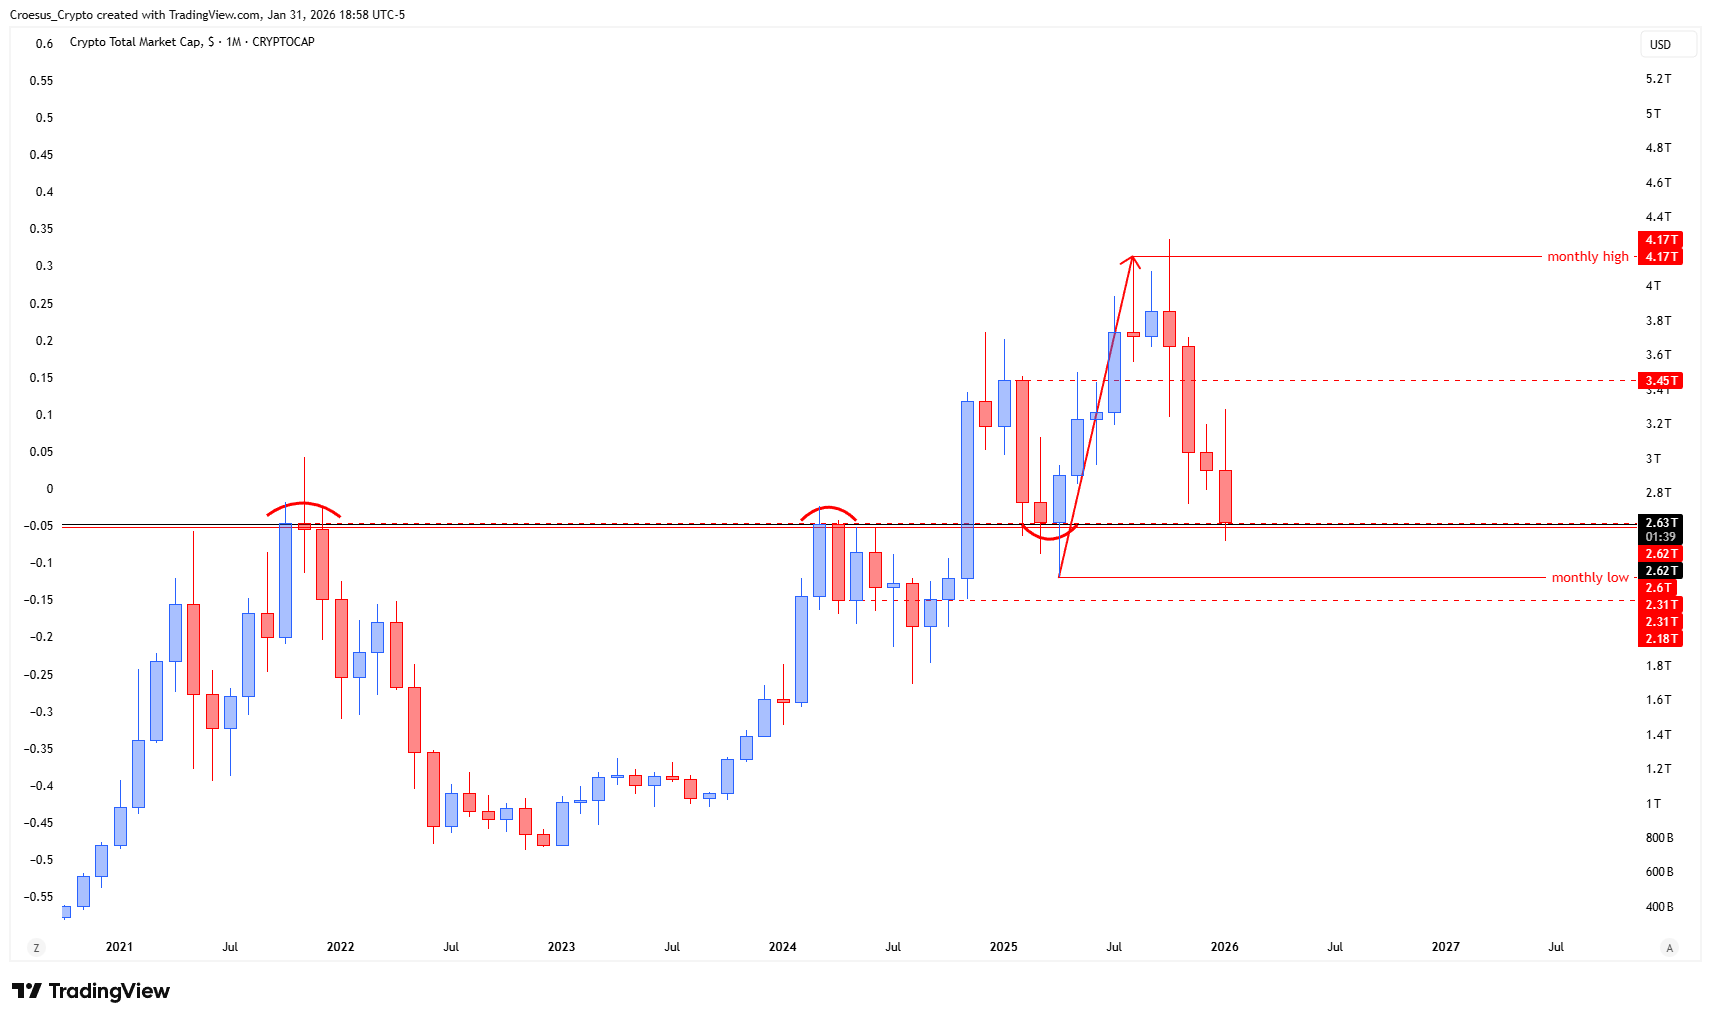
- After the last bullish monthly push up , we can see a fib 100% retracement back to the base of the impulse
- We can see that this level has been a strong buy and sell zone in the past, acting as resistance at the prior bull run top and as resistance for the first real high of this bullrun. But it also acted as support at the retest of the broken resistance. At this moment we are back at this level.
- We can see a clear monthly close above this level, showing us the desire of bulls to defend this level
Market Structure Analysis
From a market structure standpoint, our TOTAL monthly analysis shows a completed corrective leg back into the origin of the prior impulse, framed by the “fib 100% retracement back to the base of the impulse.” Structurally, this is a key inflection area because it often determines whether the previous impulsive move is being defended (support acceptance) or fully unwound (failed reclaim and continuation lower).
The horizontal support resistance context is the main driver here: the same zone previously acted as resistance at a prior bull run top, then again as resistance at “the first real high of this bullrun,” and later flipped into support on a retest after the break. With price now back at that same area, the market is effectively re-testing a major pivot. The “clear monthly close above this level” is important because it signals acceptance above resistance-turned-support, keeping the structure constructive while this correction matures.
Key Levels and Scenarios
In this TOTAL monthly analysis, the bullish scenario remains valid as long as price continues to accept above the impulse base / reclaimed pivot zone. A bearish scenario develops if the market loses this reclaimed level on a monthly basis, turning the area back into resistance and confirming rejection rather than support.
- The base of the prior impulse (100% retracement area) as the primary structural support
- The reclaimed historical pivot zone that previously acted as both resistance and support
- The prior swing highs in this region as the overhead supply area if price starts to expand upward again
- A monthly close back below the reclaimed level as the main invalidation signal for the bullish defense
This analysis is for informational purposes only and does not constitute financial advice.