

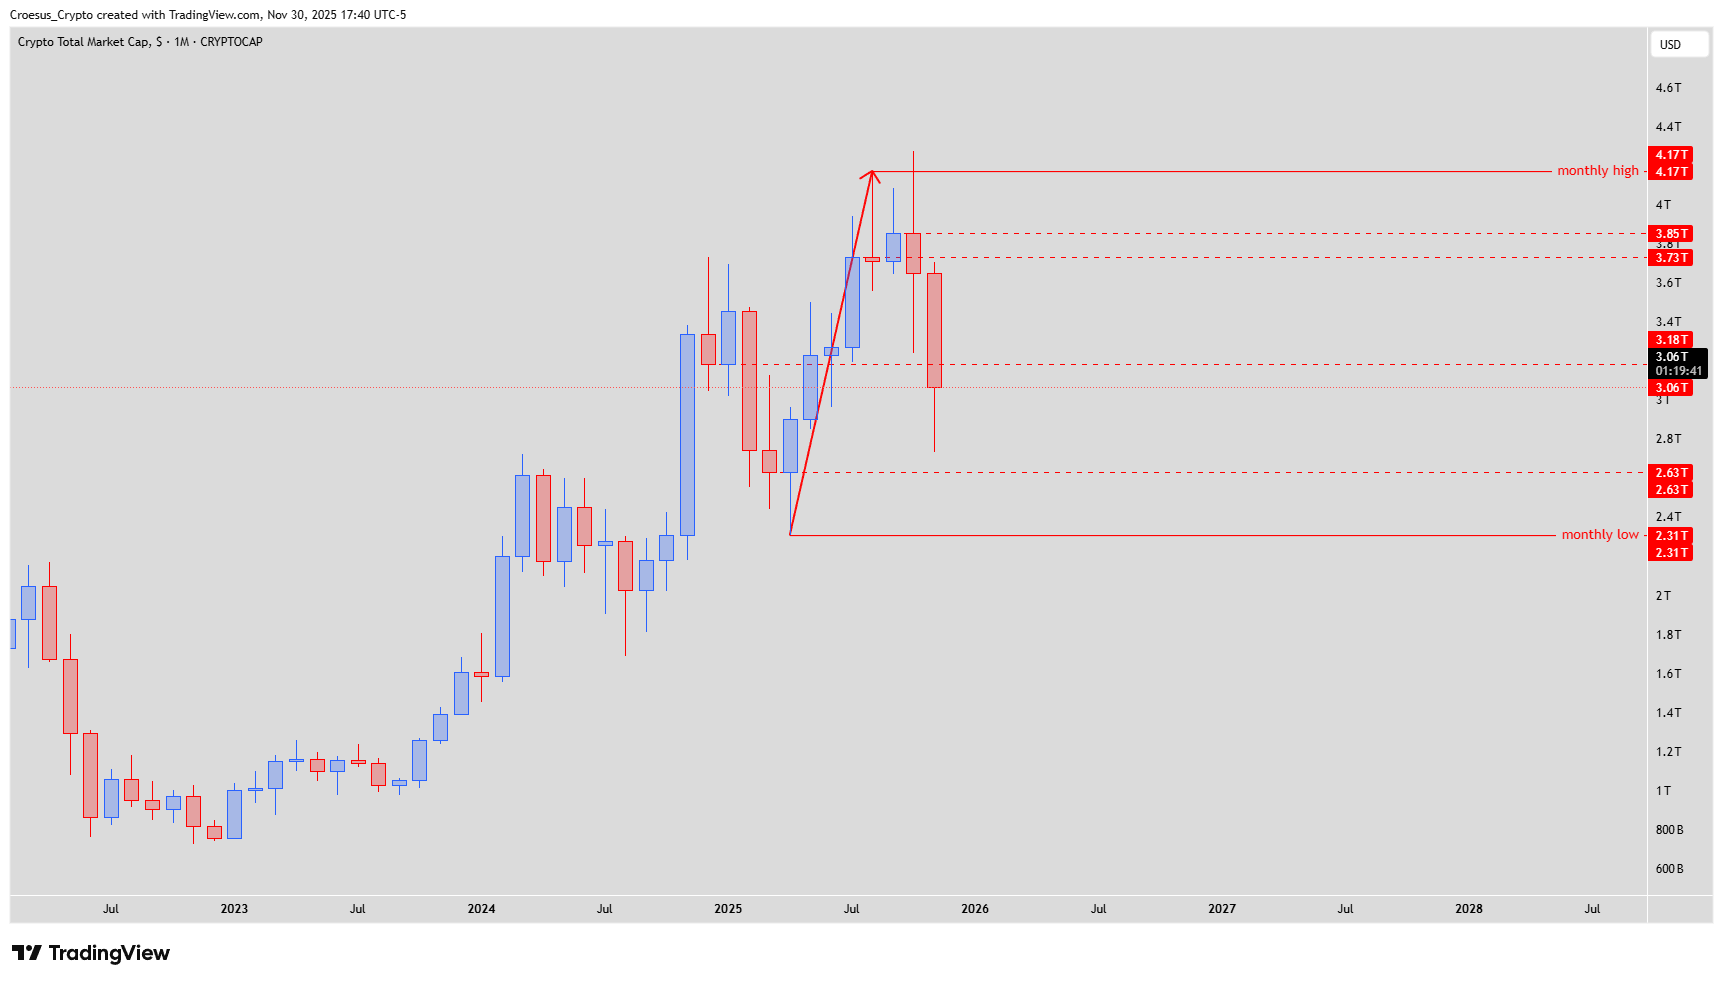
Our TOTAL monthly analysis for November 2025 focuses on the loss of the 3.18T support level and how this fits within a broader corrective phase after the strong impulsive move up. We still classify the trend as bullish on the larger timeframe, but price is clearly in a corrective technical analysis phase where several medium-term paths remain open.
TOTAL monthly chart Nov 30 2025 showing break below 3.18T support, corrective structure and key monthly high/low levels.
Trend = bullish ↑
Technical Analysis Key Points
- Phase = 1 (corrective)
- Where last month the level we looked at to hold as support @ 3.18T, at the end of this month we can clearly see that this has not been the case.
- We can still consider this being a correction before further upward continuation.
- At the end of this month we saw the index correcting already 1/3 of the move down, showing us that bulls are willing to take over (fully or temporarily)
- We have some possible developments in the market :
- 1. The index could simply continue it's bearish trajectory impulsively. At this moment the bearish momentum hasn't slowed down or shown any signs of bullish reversal other than the fact that 1/3 of the last move has already been corrected
- 2. The index could also move down slowly bottoming out, even in the fake out zone, dragging price action slowly further, wearing out the retail traders and making them sell everything. Extending the price action in time would fit in the set-up of a lengthening cycle.
- 3. This could be the turning point to the upside. We had an impulsive move up followed by an aggressive move down. Could be, but in that case we would still like to see the monthly low being touched or swept.
- 4. Worst case : bearish momentum has kicked in and we see a retest of the 3.45T level creating a shoulder 2 level of a head and shoulder pattern, showing us bearish reversal.
Market Structure Analysis
Breaking back below 3.18T confirms that prior resistance has not flipped into lasting support and that the market is still digesting the earlier vertical rally. Correcting roughly one-third of the preceding leg suggests that buyers are willing to step in, but not yet with enough strength to reclaim lost territory. The four scenarios outlined range from continued impulsive selling, through a slow grind and lengthening cycle, to a full upside reversal or a more classical head and shoulders topping pattern around 3.45T.
From a support resistance perspective, the monthly high and low of this swing act as the main outer bounds. As long as price trades between them, we treat the move as a corrective structure within a broader bullish context, with traders free to overlay their own Fibonacci grids to refine risk management.
Key Levels and Scenarios
3.18T – broken support; a key level to reclaim to strengthen the bullish case.
Monthly low – a sweep or touch would better confirm an exhaustion bottom in a bullish scenario.
3.45T – potential shoulder 2 area for a larger head and shoulders and a key “worst case” retest zone.
Current monthly close zone – gauges whether bears retain control or buyers are absorbing supply.
Trading Implications
Given the mix of bullish higher-timeframe trend and active monthly correction, we see a market where position sizing and patience matter more than precision entries, with traders planning around the four outlined structural paths rather than a single fixed scenario.
This analysis is for educational purposes only and is not financial advice or a recommendation to buy or sell any asset.